Tuesday, November 29, 2022

Free vs Regulated Banking: Canada’s Free Banking Era – A Brief History of Canadian Banking

Click here to read the original Cautious Optimism Facebook post with comments

6 MIN READ - For some time the Cautious Optimism Correspondent for Economic Affairs and Other Egghead Stuff has posted on the contrasting regulatory frameworks of the historically unstable banking systems of England (16 bank panics in 194 years) and the United States (17 panics in 216 years) against the nearly laissez-faire deregulated system of Scotland (zero panics in 129 years).

Now the Economics Correspondent begins the last chapter of the series with a final handful of articles on the exceptional performance and stability of Canada’s 118-year free banking era.

So far the Economics Correspondent has devoted a great deal of writing to explain the many destructive, perverse, and downright bad American bank regulations that contributed to its roughly seventeen bank panics going back to 1792.

By contrast Canada, which had the most deregulated banking system in the industrialized world from 1845 to 1935 (and second-most deregulated from 1817 to 1845) experienced no panics at all during its “free banking” period.

Much less penmanship is required to explain Canada’s success, for describing what Canada didn’t do (tie its banks’ hands in destructive ways) doesn’t take as long as dissecting the United States’ long chain of pernicious and destabilizing regulations or the chronologies of its multiple financial crises. 

Because Canada had very little of the first and none of the second.

Nevertheless, a very simplified overview of Canada’s banking industry and history does provide some insights.

THE BANK OF MONTREAL

During Canada’s early years of French colonization (1534-1763), money was a vague and undefined commodity. Aside from barter, attempts at a common medium of exchange included wheat, wampum (shell beads), beaver pelts, and moose skins.

These attempts at functioning monies were generally unsatisfactory since wheat and shell beads are not uniform, homogenous, or durable, and beaver pelts and moose skins are not divisible or uniform. French traders even famously tried using playing cards as money with equally unsatisfactory results.

As was the case in other western societies, coins minted from rarer metals eventually found their way into Canada, mostly higher denomination French coins from the West Indies, Spanish silver dollars minted in Mexico, and copper coins for low denomination transactions.

The French crown briefly authorized the colonial government to issue currency “cards” that could be traded for bills of exchange which in turn were redeemed for silver in France.

The new card money was initially successful, but the colonial government soon began printing “Treasury notes” alongside the cards, and upon entering the French-Indian War with Great Britain (1754-1763) quickly ended convertibility and overissued the notes leading to inflation.

At the war’s conclusion Quebec changed hands to become the British Province of Quebec, later “British North America,” and by the early 19th century commerce in cities and towns was being conducted with a hodgepodge of gold, silver, and copper coins of varying weights from different countries.

It was at this point that a group of nine merchants met in Montreal to discuss the idea of a bank of deposit and issue that could supply uniform paper currency to the local region.

The idea was not novel. By then a few hundred banks in the independent United States were already accepting gold and silver coin deposits, issuing paper banknotes, and even crediting deposit accounts to make commercial exchange less cumbersome—all instruments we take for granted today (less gold convertibility).

And commercial banking with private note issuance had already been conducted in Great Britain for well over a century.

Hence the merchants petitioned the Parliament of Lower Canada for a charter. The charter was slow in coming so the merchants decided to open without one in 1817, signing the Articles of Association founding the Bank of Montreal in a rented house.

Of the nine founding directors, a majority (five) were Scottish or of Scottish descent including John Richardson, known as the “Father of Canadian Banking.” A majority of Scots was no coincidence—something we will revisit in a later column. The other four included one Frenchman, two Americans, and one Englishman.

Hence the Bank of Montreal, Canada’s first commercial bank and still in operation today, issued the country’s first private banknotes in 1817. 

A charter for incorporation followed in 1822. The bank accepted deposits in gold and silver coin, issued banknotes and deposit accounts in exchange, extended interest-bearing loans in the form of notes and deposits, and discounted securities.

The arrival of uniform cash made conducting commerce in Montreal and surrounding areas much easier, and large commercial transactions could now be conducted at the bank instead of through schlep: the cumbersome process of hauling heavy bags of coins across town to make a large payment.

OTHER EARLY BANKS

Word of the Bank of Montreal’s success quickly spread, spurring a small wave of new bank startups. In a few short years several new banks were chartered, many of whose names have been forgotten—either by failure or more commonly by acquisition—including:

-The Bank of Quebec (Quebec City, 1818)
-
The Bank of Canada (Montreal, 1818, not to be confused with Canada’s central bank established in 1935)
-The Bank of Upper Canada (Kingston, 1819)
-The Bank of New Brunswick (St. John, 1820)
-The Second Bank of Upper Canada (York – later Toronto, 1822)

But of particular note was the creation of a new bank in Halifax, Nova Scotia. 

The privately owned Halifax Banking Company was founded in 1825, but with only a handful of private partners to fund its startup capital its regional benefit was limited.

The Legislative Assembly of Nova Scotia felt a larger public bank, funded by shares sold to the public, would better serve the colony and was amenable to providing a charter, but the Halifax Banking Company’s directors insisted on a government-granted provincial monopoly.

In a key difference between the early days of American and Canadian banking, the Nova Scotia Assembly refused to grant a monopoly and the Bank of Halifax went on operating as a limited private partnership. 

This stands in stark contrast to the American states of the 1800’s which were granting literally hundreds of local bank monopolies in exchange for bank favors, or of the U.S. federal government that bestowed an interstate branching monopoly upon its two antebellum central banks—the Bank of the United States and Second Bank of the United States—to carry out Washington, DC’s monetary policy.

Nova Scotia still lacked a large regional bank, but a few years later a group of merchants founded the Bank of Nova Scotia which opened as a publicly-owned bank, issuing shares of stock via the 1832 equivalent of an IPO. The Bank of Nova Scotia’s directors didn’t ask for a government monopoly, the bank received its charter, and a new, more heavily-capitalized competitor emerged in the Canadian market.

The Bank of Montreal and Bank of Nova Scotia remain two of Canada’s largest banks today, known to Canadians as BMO (“bee-mo”) and Scotiabank.

The story of Scotiabank’s founding is informative as it establishes an example of a pattern that was to follow for decades to come: All through the early period of Canada’s bank startups, no special government privileges were granted to Canadian banks nor were their business activities handtied by onerous regulations—although a few regulations policing fraud and insider conflicts of interest were applied.

Of particular note was branching. While in the United States state governments universally prohibited the branching of any bank into any state other than its home state, and frequently restricted branching to only two or three counties or no branches at all, Canadian banks were free to open branches wherever they wanted. It wasn’t long before most Canadian townships were served by competing bank branches operating from headquarters in Halifax, Montreal, or Toronto.

Around the time of Canadian confederation (1867), when Canada was granted self-government by Great Britain as an independent Commonwealth nation, a few other notable banks were founded.

In 1867 the Canadian Bank of Commerce was chartered and the Imperial Bank of Canada in 1875. After a series of acquisitions the two large banks merged in 1961 to create the Canadian Imperial Bank of Commerce, or CIBC.

In 1864 the Royal Bank of Canada was chartered which, through organic growth and acquisitions, grew into what has until recently been Canada’s largest bank.

Two more banks, the Bank of Toronto and the Dominion Bank, were founded in 1855 and 1869 respectively and merged in 1955 to form the Toronto-Dominion Bank which has recently overtaken Royal Bank as Canada’s largest.

TODAY

Today Canada’s five largest banks by assets (with market nicknames) are:

1. Toronto-Dominion Bank (TD)
2. Royal Bank of Canada (RBC)
3. Bank of Nova Scotia (Scotiabank)
4. Bank of Montreal (BMO)
5. Canadian Imperial Bank of Commerce (CIBC)

(note: RBC and TD have been leapfrogging over one another for the #1 position for the last few years, depending on whether one measures rank by assets, deposits, market capitalization, etc…)

East coast and midwestern Americans may have noticed the presence of Canadian banking expansion into the U.S. market in recent years, as RBC and TD branch offices have cropped up along the Atlantic coast states and southeast while BMO Harris has a large Midwest presence. 

BMO has also recently acquired Bank of the West from French supernational BNP Paribas, so BMO’s U.S. presence will soon expand significantly into the western United States.

Scotiabank has a tradition of expansion into Latin America while CIBC has remained a predominantly domestic operation.

Lastly, Canada’s “Big Five” combined assets are estimated at 42% the combined value of the USA’s “Big Four”:

1. J.P. Morgan
2. Bank of America
3. Citigroup
4. Wells Fargo
...and “number five” US Bancorp

However, considering Canada only has 11.3% the population of the United States and 7.9% the gross domestic product, the relative size of its banks but absence of any banking crises are yet more testament to the stability and success of the industry.

In Part 2 we will look closely at more regulations Canadian banks were never subjected to (and American banks were) which helped them completely avoid banking panics throughout the industry’s 205-year history.

Tuesday, November 22, 2022

Does the Stock Market Perform Worse Under Republicans? And Does Political Party Even Matter?

Click here to read the original Cautious Optimism Facebook post with comments

5 MIN READ - The third and final look at economic performance by political party from the Cautious Optimism Correspondent for Economic Affairs (and Other Egghead Stuff).

In case you missed it, the Economics Correspondent has already countered the common arguments that “Republican presidents rack up more deficits and debt” and “the economy performs better under Democrats,” pointing out that fiscal and economic performance is far superior when Republicans control Congress over Democrats at:

http://www.cautiouseconomics.com/2022/11/government-budget07.html

http://www.cautiouseconomics.com/2022/11/government-budget08.html

Now we look very briefly at the last of those drive-by partisan bombs. Namely, that superior stock market performance is credited to Democratic presidents.

Once again, the Economics Correspondent has lost count how many times he’s seen, in one form or another:

“The stock market does much better under Democratic presidents.”

“We had one of the best stock markets of all time under Bill Clinton.”

“George W. Bush collapsed the stock market and Obama pushed it up to new records.”

Once again contradictory evidence is omitted such as: the huge bull market of the 1980’s under Reagan is left out of the conversation as is the so-far tepid performance of the market after two years of Biden (DJIA +4.98% annualized).

But most importantly, yet again, the “Democrats give us better stock markets” claims ignore performance by Congress, the branch of government that controls taxes, spending, borrowing, and passes regulatory legislation.

THE DATA 

The data going back to 1980 confirm the “better under Democrats” thesis.

-During the 24 years under Republican presidents the S&P 500 index grew an average of 5.6% per year.

-During the 18 years under Democratic presidents the S&P 500 index grew an average of 11.9% per year.

But if we flip the script and look at stock market performance depending on Congressional Party control the numbers change considerably.

Fortunately for us, RBC Wealth Management (Royal Bank of Canada) has done the Congressional research and collected stock market indices data going back to 1933! They’ve calculated stock market performance when Democrats have total control of the White House and Congress and the same for Republicans (chart attached).

Yet again, Republican Congresses outperform Democratic ones.

-S&P 500 Index average annual gain with full Democratic White House/Congress control: +9%

-S&P 500 Index average annual gain with full Republican White House/Congress control: +13%

Furthermore RBC has calculated split performance with a Democratic White House + Republican Congressional Control and a Republican White House + Democratic Congressional Control.

Once again, the focus here is on performance depending on who controls Congress (chart attached).

-S&P 500 Index average annual gain with Republican president/Democratic Congress: +5%

-S&P 500 Index average annual gain with Democratic president/Republican Congress: +13%

Split control of Congress is more ambiguous but it's a subset of Democratic presidents faring better (see RBC’s chart).

PARTISAN COMPARISONS MATTER A LOT LESS THAN THE FED

Up until now the Economics Correspondent has stressed that there are actually nuanced causes for economic performance, often reaching far beyond which party controls the White House or Congress, and that liberal online posters who flood the web with simplistic “Democrats perform better with the federal debt/economy/stock market” ignore those nuances.

And although “Republican Congresses do even better across the board than Democratic presidents” is also true and nuanced, there is really one giant institution that exerts far more influence over the economy, the stock market, and to a lesser degree the national debt than Republicans or Democrats.

It’s America’s central bank: the Federal Reserve.

In the remaining paragraphs the Economics Correspondent can only ask CO Nation to accept he has studied and monitored the impact of Fed monetary policy on the economy for many years, and history clearly informs us that the last century’s major recessions, soaring stock market bubbles, and crashing stock bear markets are virtually always triggered by monetary policy and almost never by the machinations of presidents and Congresses.

The Correspondent has prepared this St. Louis Fed chart to illustrate.

https://fred.stlouisfed.org/graph/?g=WAk5

Note the pattern of the last 70 years. Every time the Fed jacks up interest rates after a period of low rates (blue line) a recession usually follows within 12-18 months (grey shaded areas).

And when recessions strike stock markets nearly always plummet into bear market territory as well (red line dips below zero – right scale).

So if you’re unlucky enough to be a president or Congress when the Fed sparks another recession, your party’s batting average will be kneecapped by sharply falling GDP, stock prices, and rising unemployment.

And during that recession falling tax revenue and increased government spending on unemployment assistance (and under Democrats, additional Keynesian “stimulus spending”) will lower your batting average for managing fiscal deficits.

Feel free to line up who was president at each of those grey shaded recessions.

WHEN DO WHITE HOUSES AND CONGRESSES MATTER THE MOST?

One last comment about the Fed’s impact on the economy versus the federal government’s.

History has taught the Economics Correspondent that the machinations of presidents and Congresses have rarely plunged economies into recession. Although it’s possible for a crazy enough politician (look at Hugo Chavez) to do it without a central bank, so far in the USA it’s been rare – save Bernie Sanders becomes president with AOC House Speaker.

However one area where presidents and Congresses have historically made a huge impact is when economies are struggling to recover from recessions. 

A detailed study of recoveries after the initial crashes during the Great Depression, the Great Recession, and other slumps like the Depression of 1920 and 19th century depressions informs us that once an economy is on the ropes, it can recovery quickly and strongly or it can limp along for years—all depending on not only what the central bank does (if there is one), but also greatly on whether a White House or Congress screws things up even more.

There’s too little space to go into each case here, but a few short examples include:

During the Depression of 1920, President Warren Harding and Congress did virtually nothing (other than slashing the federal budget) and full employment was restored in two years. 

And in the 19th century, when federal recession policy was nearly laissez-faire, economies typically recovered in two or three years with the absolute longest delay to full employment after the Panics of 1839 (four years) and 1896 (four years).

By contrast after the stock market crash of 1929 the Hoover and FDR administrations intervened to “fix” the economy at an unprecedented rate in American history – doubling the level of real government spending, raising tax rates by over 150%, initiating an international tariff trade war, spreading price and wage controls through the economy – and it took 17 years to return to private sector full employment.

The next most interventionist recovery in U.S. history was after the 2008 financial crisis – with massive bank bailouts, QE1, QE2, QE3, years of zero interest rates, trillions in deficit stimulus spending, the enactment of Obamacare and thousands more regulations – and the recovery to full employment was the second slowest in American history at seven years.

Wednesday, November 16, 2022

Does the Economy Perform Worse Under Republicans? (Part 2)

Click here to read the original Cautious Optimism Facebook post with comments

4 MIN READ - Another round of partisan economics from the Cautious Optimism Correspondent for Economic Affairs and Other Egghead Stuff.

As we mentioned in the Economics Correspondent’s previous column, now that midterm elections are over and the Republicans appear to have gained control of the House of Representatives, legislative battles and gridlock between GOP leadership and the Senate and Biden White House are probably inevitable.

Also without doubt we'll see an escalation of partisan rhetoric about the two major parties’ economic track records from all directions, including this old classic that the Economics Correspondent has seen in various forms more times than he can count:

“The economy traditionally performs better under Democratic presidents.”

“Bush, Bush Jr, and Trump all gave us recessions while Clinton, Obama, and Biden had to come in and clean up the mess.”

The Economics Correspondent addressed the similar “fiscal deficits and debt are worse under Republican presidents” soundbites at:


Of course these sorts of generalizations about overall economic performance, posted frequently by liberal and Democratic-leaning commenters, are always short on details and usually ignore inconvenient data like (for example) the Ronald Reagan 1980’s was fastest decade of real GDP and per-capita GDP growth in the last half-century.

But the much greater oversight, once again, is the exclusive focus on presidents and complete disregard for Congress—you know, the branch of government where tax policy, government spending, borrowing, and regulations all originate—as if Capitol Hill has no role whatsoever in the economy.

So just as we uncovered in Part 1 on deficits and debt, a closer look at economic performance by Congressional party control also reveals why Democrats never, ever mention Congress.

THE ECONOMY BY CONGRESSIONAL PARTY CONTROL

If we go back to 1980 and compile the average percent change in real GDP under Democratic vs Republican presidents, those liberal/detail-deficient one-liners are confirmed: the economy has performed slightly better under Democratic presidents – attributable to George H. W. Bush presiding over a recession, George W. Bush presiding over two recessions, and Donald Trump presiding over the Covid recession:

Republican presidents: 24 years, average real GDP growth +2.47%

Democratic presidents: 18 years, average real GDP growth +2.91%

Conclusion: Democratic presidential GDP growth rates have averaged 17.8% higher than Republican ones.

(Source data at end of column: St. Louis Federal Reserve and U.S. Bureau of Economic Analysis)

But once again Democrats never mention the economy’s performance when Republicans or Democrats control Congress. And for good reason.

According to the Senate Joint Economic Committee (which only measures from 1987 to 2016) not only do Republican Congresses outperform Democratic ones, but by a much wider margin.

Republican control of Congress: 12 years, average real GDP growth +3.48%

Democratic control of Congress: 12 years, average real GDP growth +2.06%

Split control of Congress: 6 years, average real GDP growth +1.75%

Conclusion: Republican Congress real GDP growth rates have averaged 68.9% higher than Democratic ones.

(See attached chart, Senate.gov source at end of column)

Prior to 1987 Congressional control was split, and after 2016 Republicans enjoyed control for two years (2017-2018), Democrats for two (2021 and 2022 so far), and the remaining two have also been split (2019-2020).

Factoring in this handful of additional years to fully cover 1980-2022 the Economics Correspondent calculates the gap narrows slightly with Republican Congresses outperforming Democratic ones +3.35% to +2.19%, or 53% stronger.

And what about unemployment?

That’s one we don’t hear about as much, because the unemployment rate under Democratic presidents isn’t that much different from Republican ones. Going back again to 1980:

Republican presidents: 24 years, average unemployment rate: 6.16%

Democratic presidents: 18 years, average unemployment rate: 6.13%

But once again, the unemployment rate is far lower under Republican controlled Congresses.

Republican control of Congress: 16 years, average unemployment rate: 4.93% (i.e. full employment)

Democratic control of Congress: 14 years, average unemployment rate: 6.31% (i.e. recession level)

Split control of Congress: 12 years, average unemployment rate: 7.58%

(Source data at end of column: St Louis Federal Reserve and Bureau of Labor Statistics)

SUDDENLY REDISCOVERING NUANCE

In the Economics Correspondent's personal experience those who argue “the economy is better under Democratic presidents” once again instantly discover the need to discuss nuance and detail when confronted with the logical counter: “the economy fares far better under Republican Congresses.”

The Economics Correspondent has frequently seen rapid pivots to “well that's only because” backdoors like “Well Democratic Congresses had to clean up a recession that Bush Sr. and Bush Jr. left them. That’s why GDP growth and unemployment aren’t that great for Democrats."

But as always, “the other party left us with” argument can be applied both ways.

For example: “Ronald Reagan had to clean up the mess Jimmy Carter and literally 26 years of total Democratic Congressional control left him.”

Or “George W Bush and the Republican Congress had to clean up the recession Bill Clinton left behind as he departed office.”

Or using their same logic, even: “The Republican Congress had to clean up the 2008 Financial Crisis and Great Recession that began under a Democratically controlled Congress.”

But just as the Economics Correspondent explained in his Part 1 column, Democratic-leaning/liberal/socialist commenter meme bombs about Republican presidents overseeing inferior economic growth are virtually always absent any specifics, details, and of course mention of Congress.

It's only when confronted with a retort about economic growth being far superior under Republican Congresses that they suddenly claim the circumstances are more complex than soundbites and insist multiple factors need to be analyzed more closely.

Unfortunate that they’re not willing to disclose things are a little more complicated in the real world until the conversation turns against the first narrative.
====
(from the Economics Correspondent) Source data:

1) Real GDP growth by year: St. Louis Federal Reserve and U.S. Bureau of Economic Analysis

2) Real GDP growth by Congressional party control: U.S. Senate Joint Economic Committee

3) Unemployment rate by year: St. Louis Federal Reserve and Bureau of Labor Statistics

4) Party division/control of Congress by year.


Monday, November 14, 2022

Are Fiscal Deficits and Debt Worse Under Republicans? (Part 1)

Click here to read the original Cautious Optimism Facebook post with comments

4 MIN READ - Partisan economics from the Cautious Optimism Correspondent for Economic Affairs and Other Egghead Stuff.

Click to enlarge

So with midterm votes still being “counted” and anyone questioning how long results are taking being called an election denier, there’s still a shrinking window of opportunity for the GOP to gain control of the House of Representatives. Should the Republicans secure a majority, however small, budget battles with the Biden White House will inevitably erupt and we might even see a government shutdown somewhere in the next two years.

And once the disagreements begin we’ll without doubt hear budget rhetoric from all directions including this old classic that the Economics Correspondent has seen in various forms more times than he can count:

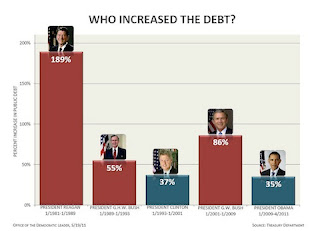
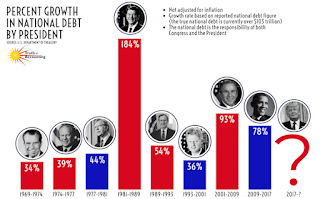
“Deficits soar under Republican presidents and come down under Democrats.”

“Reagan, Bush, Bush Jr, and Trump ballooned the deficit while Obama cut the deficit in half and Clinton gave us a surplus.”

“Republicans claim to be the party of fiscal discipline but they’re not. Reagan ran up a huge debt and Clinton balanced the budget.”

And they’ll probably include simple shock visuals like these:


While the Economics Correspondent won’t argue with some of the literal claims made in these quotes or charts, other than perhaps…

1) Focusing on “increase in the national debt” is not as important as “increase in the debt as a size of GDP” since borrowing $200 billion in the 1980’s was a bigger deal than borrowing $500 billion in 2022. Given the last four decades’ growth in real GDP plus inflation, $200 billion in 1982 was 5.9% of GDP and $500 billion in 2022 is 1.9% of GDP.

Thus applying the more meaningful definition of “ran up the debt,” profligate borrower George W. Bush increased the national debt by 13% of GDP while “cut the deficit in half” Barack Obama increased the national debt by 37%. 

2) Obama and Biden both slapped on huge spending packages their first years and ballooned the deficit so they could take claim for “drastically reducing” the deficit years later.

…the real 800-pound-elephant-in-the-room which marginalizes the entire “deficit by president” thesis is completely missing: the actual fiscal branch of government (Congress).

After all, the U.S. Constitution grants Congress the exclusive power of the purse: the “Power To lay and collect Taxes, Duties, Imposts and Excises, to pay the Debts and provide for the common Defence and general Welfare of the United States... … To borrow Money on the credit of the United States” 

-Article I, Section 8

The Constitution grants no such powers to the President who can only draw up his/her own budget and hope Congress adopts some of the measures.

So you would think it’s a bit strange the Democrats/liberals/socialists not only are always pointing fingers at Republican *presidents* for budget malfeasance, but that it’s even more unusual they are completely silent on the branch of government that really matters when it comes to fiscal matters: Congress.

Well one only need look at the data to understand why. 

Deficits and the growth of the debt under Democratic Congresses are larger by multiples than under Republican ones.

What data support this claim? 

Well first let’s establish the tricky business of measuring debt and deficits over several decades. Simply looking at nominal dollar numbers and adding them up isn’t useful because, as previously mentioned, a $200 billion deficit in 1982 was three times larger as a share of GDP than $500 billion is today.

So the best measure is to record four decades of deficits or surpluses as a % of GDP every year that Democrats have controlled both houses of Congress, and the same when Republicans have had full control.

Therefore if we go back to 1980 as Jimmy Carter was about to lose the White House to Ronald Reagan, and measure through 2022, whose fiscal year just ended last month, we get the following results.

-Democratic full control of Congress: 14 years (100th-103rd, 110th-111th, 117th Congresses)

  Average deficit as a share of GDP: 4.90%

-Republican full control of Congress: 16 years (104th-109th, 114th-115th Congresses)

  Average deficit as a share of GDP: 1.47%

(Source data in comments section: St. Louis Federal Reserve and U.S. Office of Management and Budget)

Split control of Congress is so much more complicated that it’s not worth pinning on one party or another. However, the data show that in the twelve years that Democrats and Republicans have split the two houses of Congress (1981-1986, 2011-2014, 2019-2020) budget deficits have been the worst of all, averaging 5.70% of GDP. 

Finally, the Economics Correspondent has posted these numbers online before, to which liberal posters who had previously condemned Republican presidents have quickly retorted “Well there’s more to it than just those Congressional numbers. For example Democrats were in charge of Congress during the 2008 Financial Crisis which blew a hole in the budget, something they had no control over.”

Well “no control over that” is true, but if we’re going to take circumstances beyond a Congress or president’s control then we also have to consider (which they once again ignore):

-When Donald Trump ran a huge deficit in 2020 as the economy was shut down and not generating tax revenue and the federal government was borrowing trillions for Covid stimulus spending, the then Democratic Congress blocked his stimulus packages unless additional moneys were added for gender studies in Pakistan, Cambodia, Guatemala, Costa Rica, and Burma, renovating the Kennedy Center, “race riot studies,” the construction of Latino and Women’s history museums, tens of billions more for state/local transportation systems and Amtrak, grants for block universities and “live entertainment venues” like New York’s Broadway, expanded private Internet access… the list goes on and on.

-Other mitigating factors include every country on earth was hit by Covid and they virtually all ran large fiscal deficits as well, the spread of Covid ultimately proving to be beyond any country’s ability to control.

But what’s most telling of all is when lefties post broad indictments like “Republican presidents always run up the debt” there’s absolutely zero room for nuance or detailed causes in their discussion.

Until….

They’re faced with an equally broad counter like “Democratic Congresses always run up the debt even faster” at which point they suddenly discover an interest in refined cause and effect or searching for answers deeper than soundbites.

That they knew all along that there were more nuanced explanations and details but deliberately withheld them when posting meme bombs, and only pulled out specifics when confronted with factual counters, speaks volumes in and of itself.