Tuesday, May 31, 2022

Washington Post Covers for the Fed's Inflation (Again)

Click here to read the original Cautious Optimism Facebook post with comments

The Cautious Optimism Correspondent for Economic Affairs and Other Egghead Stuff discovers yet more press baloney about inflation.

From yesterday's Washington Post attempt to misidentify the source of inflation and lead readers away from the Federal Reserve itself:

"On July 19, 2021, President Joe Biden played down the risk of persistent inflation, telling reporters that price hikes "are expected to be temporary." This month, Biden called reining in prices his "top domestic priority."

"What changed?"

"A combination of factors - including surges in the coronavirus, supply chain problems, Russia's invasion of Ukraine and a dramatic shift in consumer spending patterns - all made things more expensive."

Nowhere in the lengthy article is there any mention of the Federal Reserve inflating the money supply by more than 44% in the two years after the outbreak of the Covid pandemic, and continuing to inflate even after offsetting factors like falling velocity had levelled off by the third quarter of 2020. 

Compare the 44% expansion of M2 in two years to 40% during the *entire decade* of the 1990's.

No, according to the Post inflation was just caused by a strange confluence of spontaneous factors in the mother of all coincidences and couldn't possibly be the consequence of printing money at the fastest rate since World War II, outpacing even the 1970's stagflation era.

Read WaPo article at:

https://www.washingtonpost.com/us-policy/2022/05/31/inflation-economy-timeline/

ps. If you can't get past the WP paywall Yahoo! has recycled the Fed apologetics at:

https://www.yahoo.com/finance/news/u-policymakers-misjudged-inflation-threat-184526878.html

Thursday, May 26, 2022

A Little More Inflation Math: $5 Trillion Deficits and a $100 Trillion National Debt in 25 Years

Click here to read the original Cautious Optimism Facebook post with comments

A little more inflation math from the Cautious Economics Correspondent for Economic Affairs and Other Egghead Stuff.

Suppose for a moment inflation remains sustained at 8.5% for a year.

At last check the national debt was $30.47 trillion.

So after one year the real value of the national debt is reduced by 7.8% (inverse of +8.5%) and the federal government has been absolved of $2.38 trillion in obligations—all through inflation—with holders of U.S. dollars forced to donate the difference.

And that’s just one year. 

With each additional year of dollar devaluation the government’s obligations are further watered down. 

With a lower 3.5% inflation rate over a trillion dollars of debt is wiped off the books, year after year.

Throw in economic growth and the numbers really start to add up.

If the real economy grows by 2.5% and the Federal Reserve produces an even lower 2.5% price inflation atop it the federal government can run a $1.54 trillion annual deficit with absolutely no change in the federal debt-to-GDP ratio.

The following year it can run a $1.62 trillion deficit. Then $1.70 trillion. Then $1.79 trillion. The federal debt-to-GDP ratio still never changes.

25 years from now the federal government can run annual $5 trillion deficits (yes, $5 trillion a year). That's deficits for 25 years straight, never once a surplus or a balanced budget, and a $100 trillion national debt.

And the debt-to-GDP ratio will still be the same as it is today. All thanks to growth and inflation, the latter being paid out of the pockets of savers via the stealth tax.

The Treasury, CBO, and most career members of Congress have already baked these expectations into their future deficit spending plans, spending they are counting on to secure the votes they’ll need to stay in office.

So the U.S. Treasury sends heartfelt thanks to the Federal Reserve for its assistance, as does Congress which is now able to borrow and spend even more in the coming years. And when the inflation bill comes due both can deflect blame onto “corporate greed” and "price gouging" which half of America is economically uninformed enough to believe.

The trick is nothing new. Adam Smith noted this sleight-of-hand in 1776 when he wrote in The Wealth of Nations that:

“When national debts have once been accumulated to a certain degree, there is scarce, I believe, a single instance of their having been fairly and completely paid.”

“The raising of the denomination of the coin has been the most usual expedient by which a real public bankruptcy has been disguised under the appearance of a pretended payment”.

“The honour of a state is surely very poorly provided for, when, in order to cover the disgrace of a real bankruptcy, it has recourse to a juggling trick of this kind, so easily seen through, and at the same time so extremely pernicious." (Book 5, Chapter 3)

Governments love inflation.

Wednesday, May 25, 2022

A Little Inflation Math: Your IRS Tax Refund

Click here to read the original Cautious Optimism Facebook post with comments

A little inflation math from the Cautious Economics Correspondent for Economic Affairs and Other Egghead Stuff.

Suppose for a moment inflation remains sustained at 8.5% for a year.

Now suppose also that you get a refund from the IRS when you file your taxes at the end of the year.

Most people know that getting a refund means you’ve granted the Department of the Treasury an interest free loan for the use of your money, and that receiving a tax refund means “You haven’t beaten the IRS, the IRS has beaten you.”

However due to inflation you receive your refund in devalued dollars, worth about 8.5% less than when they were withheld from your paycheck a year prior.

So not only have you given the government an interest free loan, but as Milton Friedman pointed out in the 1970’s, you’ve effectively paid the government 8.5% interest for the privilege of lending them your hard-earned money.

Governments love inflation.

Tuesday, May 24, 2022

Progressives Argue Central Banks Not to Blame for Global Inflation: "Are Other Countries Printing Money Too?"

Click here to read the original Cautious Optimism Facebook post with comments

The Cautious Optimism Correspondent for Economic Affairs and Other Egghead Stuff has seen quite a few online comments recently trying to blame 40-year high inflation on something, anything… anything at all, other than the federal government or the Federal Reserve.

In their last ditch effort to deflect blame from Joe Biden, Congress, or the central bank, the latest excuse has been “It's not the money supply or government spending. It's global supply chain issues.”

The evidence? Inflation is high around the world, not just in the United States. Therefore it has to be supply chain issues that are "global" since printing money is not.

“Like all the other countries printing money too?” they ask.

Well if they had bothered to check first they'd already know the answer is yes.

United States
Canada
United Kingdom
Eurozone
Japan
South Korea
Australia
“There was a time when monetary policy aggregates were important determinants of inflation and that has not been the case for a long time.”

-Federal Reserve Chairman Jerome Powell Congressional testimony (Feb 24, 2021)

Wednesday, May 11, 2022

Have U.S. Workers Really Gotten Zero Share of Productivity Gains Since 1980?

Click here to read the original Cautious Optimism Facebook post with comments

7 MIN READ - From the Cautious Optimism Correspondent for Economic Affairs and Other Egghead Stuff.


Anyone who’s read even a few left-leaning articles about “income inequality” has probably heard or seen it: “Worker pay has been flat since 1980 while companies have logged huge gains in productivity.” 

The attached chart (left) and countless others like it are circulated endlessly around the Internet by apostles who declare it undeniable proof that evil CEO’s and shareholders are reaping all the benefits of higher productivity while workers are getting shafted. Of course the proposed solution is always higher taxes on wealthier Americans and more government wealth redistribution.

But the reality is since 1980 worker compensation has slightly outpaced productivity gains, provided one measures what workers get and what companies get honestly. 

Which means using proper (not just politically useful) metrics: worker compensation vs multifactor productivity. Because “wages vs productivity” is an erroneous comparison of epic proportions which  assumes:

1) Companies pay zero for their employees’ fringe benefits, and more critically…

2) Companies pay zero to achieve all their productivity gains.

COMPENSATION, NOT WAGES

The first mistake in both this left-wing thesis and their charts is to measure workers’ share of productivity gains by "non-supervisory wages."

OK, “wages” aren’t the same as “compensation.”

What a statistic like “wages” ignores is the growing role of fringe benefits in employee compensation over the last half century. Counting wages alone ignores the substantial expense companies incur to subsidize private health insurance for employees and their families, dental and vision insurance, life insurance, and other coverages for long-term disability or accidental death. 

Many companies also pay sick leave and free maternity leave for hours not worked, college tuition assistance, for employee assistance programs, childcare benefits, and financial planning resources.

Compensation can also include 401k retirement plan matching contributions and stock options. The Economics Correspondent doesn’t know if retirement/pension funding are included in the left’s mainstream “wages” graph, but will wager a good bet that they aren’t.

Granted, it’s true these benefits aren’t cash payments, and the Economics Correspondent thinks it’s a sad statement of our times that employers have to pay out so much worker compensation in the form of health insurance instead of higher paychecks.

(That’s the result of decades of government policy/regulations driving up healthcare costs—more about that in another column)

But what can’t be denied is that these benefits cost companies a lot of money, and the costs are completely excluded from liberal charts that allegedly “prove” they are paying no more to their workers than they did forty years ago.

Another manipulation is to exclude supervisory pay and compensation which, by omitting higher earning workers, artificially lowers the slope of the “wages” graph. 

The same people who promote these charts would like Americans to believe supervisory workers shouldn’t be counted because the skyrocketing pay of greedy, overpaid corporate executives misleadingly portrays an improving picture for the other 99%. 

But the reality is “supervisory personnel,” whose wages are rising faster than nonsupervisory personnel, means anyone who oversees, hires, or fires workers. That’s store managers at countless McDonalds, Subway, Starbucks, or other restaurant or retail stores across the country. It means the motel front desk manager, the local landscaper who recruits hired hands, or mom and pop owners of local hardware or arts and crafts stores—effectively many millions of people.

These supervisory workers vastly outnumber CEO’s and, even with large CEO and executive pay packages, the collective compensation of this enormous pool of workers means they have a far greater impact on rising overall compensation than a handful of corporate suits.

Leaving them out further falsifies the compensation picture.

Of further consequence is that wages of millions of non-supervisory employees have been artificially dampened by the introduction of tens of millions of illegal immigrants who have depressed pay for less skilled workers. Yet the mass influx of lower-skilled, wage-suppressing illegal immigrants is championed by the very people circulating charts that “prove” corporations are ripping off workers.

So the use of “wages only, and only for non-supervisory workers” data distorts the picture of worker compensation in multiple, insidious, and disingenuous ways.

MULTIFACTOR PRODUCTIVITY, NOT PRODUCTIVITY

But manipulation of employee compensation data looks insignificant when compared to the greatest misrepresentation of all: using productivity to portray companies as making gigantic gains in output—and presumably sales—while leaving workers in the dust.

Because “productivity” assumes companies achieve all those output gains for free.

The Bureau of Labor Services defines labor productivity as:

 “Output per hour of labor.” 

...a fairly simple concept that most people understand.

But the BLS defines the much more relevant metric of "multifactor productivity" (sometimes also known as “total factor productivity”) as:

“A measure of economic performance that compares the amount of output to the amount of combined inputs used to produce that output.  Combinations of inputs can include labor, capital, energy, materials, and purchased services.”

In other words, multifactor productivity equals productivity gains minus costs to achieve them.

The forty-year trend line in such charts omits completely the literally tens of trillions of dollars in ceaseless business investment and upgrading of capital tools, machines, and factories or even the increase in compensation they pay workers to achieve those gains, one of the factors left-progressives have such alleged grievances with in the first place.

They may as well chart out a line for “revenues” and call it “profits” since in their world there are zero costs.

A single example of adjusting for multifactor inputs is the gains in output from land-based oil rig workers over the last decade. 

With improvements in drilling rig technology, horizontal drilling techniques, smart drill bits, and geological computer analysis, an oil and natural gas contractor can drill and complete a well in a fraction of the number of days it used to take even a decade ago. This allows the company to charge a slightly higher dayrate—market competition allowing—while paying fewer worker hours to achieve the same quantity of output, i.e.. higher productivity.

And that's what liberal activists put in their charts: the company pocketing all those gains and paying nothing to achieve them.

But that’s a ridiculous assumption. A new, modern onshore drilling rig with all the technological bells and whistles needed to achieve those gains can cost over $100 million...  for one rig. Now multiply that by the over-270 rig fleet for leading U.S. contract driller Helmerich & Payne alone.

The typical “wages vs productivity” fiction floating around the Internet not only pretends those costs don’t exist, it also ignores many other peripheral costs such as transportation of workers to the remote site, lodging, food and laundry services, energy consumed to operate the drill site, maintenance of the rigs, chemicals, water, etc. and yes, the rising annual compensation for the workers themselves. 

One might as well claim airlines pay zero to procure new $250 million fuel efficient aircraft, semiconductor companies pay zero for new $15 billion fab plants, and wireless carriers pay zero for multibillion dollar network and nationwide cell tower upgrades. 

One very technical note: when it comes to capital expenditures, multifactor productivity only accounts for depreciation. An oil driller might spend $100 million on a new rig, but if they can sell it eight years later for $25 million then only $75 million is factored into MFP. That’s the fairest measure of capital expenditure, but once again mere “productivity” throws even the $75 million in capital depreciation out too.

REAL MATH AND REAL TRAGEDY

So if we chart the two statistics that truly reflect the real state of multifactor productivity growth and worker compensation in the U.S. economy, we get a very different picture (see right diagram attached). 

Workers are doing a lot better than we’re told, and their total compensation in real terms has slightly outpaced multifactor productivity since 1980.

There is, however, one tragedy that has consistently worked against employees for decades. 

Although worker productivity and compensation have both risen steadily, Americans have sadly been forced to “trade away” more and more of those gains for their three most rapidly escalating costs of living: housing, healthcare, and college education. Not only have these three purchases traditionally been the most expensive for everyday consumers (right after income taxes), but uncoincidentally they’re also three of the most heavily government-regulated sectors of the economy.

Healthcare inflation has manifested itself in that very flattening “wage” graph because real cash raises have been heavily displaced by the rising cost of employer-paid health insurance. 

College education costs have skyrocketed as the federal and state governments have subsidized students to the tune of hundreds of billions of dollars, prompting colleges to simply raise tuition, room, board, and books in tandem. In economics terms we say the government has pushed the demand curve to the right (see URL image).


The federal government's nationalization of the student loan industry market over a decade ago hasn’t helped either.

And blue states, and particularly blue cities, have clamped down on homebuilding with restrictive zoning laws and construction moratoriums, artificially limiting the supply of housing as demand relentlessly rises. Years of Federal Reserve-generated zero interest rates has ballooned the amount homebuyers can borrow, so demand has exploded while supply has been capped.

A worker’s productivity and pay can multiply tenfold, but if no new housing construction is allowed then workers trade away most of those gains in the bidding war that ensues for the government-imposed limit on available units.

That’s the real tragedy that has hurt workers: U.S. companies have done their job and employed ingenious ways to produce more with less labor, and workers have shared in those gains. But government interventions in the important consumer sectors of housing, healthcare, and college education have forced workers to sacrifice nearly all those gains to the artificial “rat race” created by state-imposed scarcity.

For those who wish to adjust the date windows at the Federal Reserve chart website, you can go to:

Wednesday, May 4, 2022

High Gas Prices Not Driving 8.5% Inflation Today, Have Never Driven High Inflation in U.S. History

Click here to read the original Cautious Optimism Facebook post with comments

Milton Friedman (1912-2006)
“Gas prices… …were up more than a dollar above [Ukraine] pre-invasion level. That roughly 25% increase in prices will drive tomorrow's inflation rating.”

-Jen Psaki, White House Press Secretary (April 11, 2022)

“If the government can, it will blame external sources [for inflation]—my own government has tried to put the blame on the Arab Sheiks who raised the price of oil.”

-Milton Friedman (1975)

7 MIN READ - The Cautious Optimism Correspondent for Economic Affairs and Other Egghead Stuff explains in detail why rising oil prices have never caused high inflation in American history, and why rising oil prices aren’t the cause today either.

It seems every day now we hear the blame for inflation laid at the feet of oil prices—by Joe Biden and other government officials, by Federal Reserve Chairman Jerome Powell, by liberal and even some conservative economists, by the traditional media, and even from business news outlets.

During the western world’s stagflation era of the 1970’s, Milton Friedman disparaged the government’s official excuse for inflation: that an oil price shock was responsible for the decade’s rapid price increases.

But how could Friedman have possibly believed that? Isn’t it true that higher oil prices bleed over into an endless list of other products and services that use oil as an input? And that higher oil prices drive all their prices up too, creating inflation?

In the Economics Correspondent’s opinion, it’s understandable that many in the public might view this explanation as plausible. But it’s sad that decades after settling this question so many in the economics profession and business news community are still falling for and promoting a fallacy.

Let’s explain.

INFLATION: ONLY THREE CAUSES

In 2020 the Economics Correspondent posted several articles on inflation where he stressed the value of the monetary Equation of Exchange which explains price movements. The Equation of Exchange has been around in written form for over two centuries, in mathematical form since 1911, and it has yet to be overturned today.

According to the equation only three variables can raise the overall price level in an economy (ie. cause inflation):

1) An increase in the money supply, known to many as too much money chasing too few goods

2) A reduction in the quantity of goods and services, known as the same amount of money chasing fewer goods

3) An increase in the pace at which each unit of money is spent instead of hoarded (velocity)

Or in mathematical terms, mv = py.

If we isolate prices, the equation becomes p = mv/y.

Velocity plunged in the second quarter of 2020 during the nationwide Covid lockdowns but has remained nearly constant ever since. So we can simplify and remove v from consideration for now.

OK, so how do the remaining two variables somehow prove higher oil prices don’t drive rapid inflation?

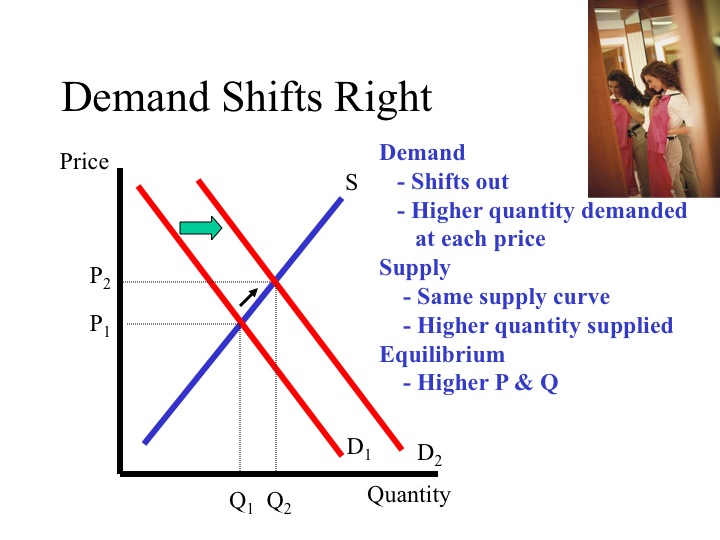
We’ll look at empirical evidence in a moment, but if the supply of money is held constant and consumers and businesses are forced to pay more for oil and oil-based products then they will necessarily have lower cash balances remaining to buy everything else. The lower cash-demand for other products will drive an offsetting reduction in the prices of other goods and no change in the overall price level.

But it’s important to note this holds true only if the central bank doesn’t increase the money supply at the same time.

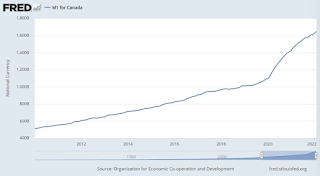
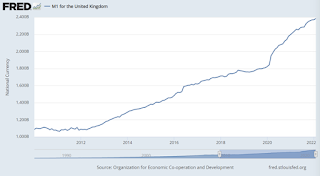
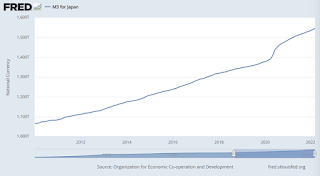
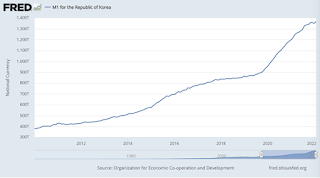
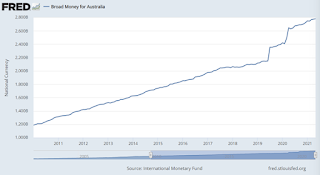
Of course this is not the world we live in. Our central bank, the Federal Reserve System, quietly and insidiously inflates the money supply consistently year after year and has increased it by 44% since February of 2020. 

Hence in the real world where the money supply grows constantly, when oil prices rise consumers and businesses not only pay more for energy and oil-based products, but they also manage to hold large or even larger remaining cash balances (courtesy of the Fed) to buy other goods whose prices also rise, and we get inflation.

And government bureaucrats blame rising oil prices for the inflation, not the swelling money supply that facilitates it. As Milton Friedman said in 1977:

"All other alleged causes of inflation—trade union intransigence, greedy business corporations, spend-thrift consumers, bad crops, harsh winters, OPEC cartels and so on—are either consequences of inflation, or excuses by Washington."

OK this idea of “less money left to buy other products” might sound workable on paper. But is there any real evidence for this theory?

EMPIRICAL EVIDENCE

There’s no shortage of exhibits that contradict the “higher oil prices cause high inflation” narrative.

Let’s start with an easy one. During the 1970’s the government blamed rising oil prices for inflation virtually every day.

OK, so if rising oil prices were the culprit, then when oil prices collapsed in the 1980’s the overall price level should have correspondingly fallen. After all, it was oil that sent prices rising, so remove that factor and prices should go down.

Is that what happened in the 1970’s and 1980’s?

Of course not. We all know it.

The OPEC embargo did send oil prices soaring. From 1974 to 1980 oil rose from $10.11 to $40 a barrel.

Oil prices then collapsed in 1986, falling all the way back to $10.42, nearly the same price as in 1974.

So if oil was really to blame, then the overall price level at the end of 1986 should have fallen back to 1974 levels.

But it didn't. By the end of 1986 the Consumer Price Index was 137% higher than in early 1974 (source: St. Louis Federal Reserve). This despite real GDP having expanded 46% in the same period, meaning prices should have fallen not only to 1974 levels, but another 32% further.

In fact even in 1986, when oil prices underwent their spectacular collapse, the CPI didn’t even fall within that single year, rising by 1.4% instead. According to the oil price argument, prices should have plunged in 1986.

What was the culprit for the stubborn inflation in the face of collapsing oil prices? The only remaining factor: the money supply. From 1973 to 1986 the money supply as measured by M1 rose by 190%, nearly tripling in thirteen years. Velocity also rose modestly, up 16.9%.

Just as Milton Friedman argued throughout his career, money was to blame.

How about other oil price spikes? When Saddam Hussein invaded Kuwait in 1990 and early 1991 oil prices more than doubled, a faster increase than we’ve seen in 2022. Given that today we’re reading about 8.5% or 10% price hikes, the inflation rate must have reached into the teens, right?

Nope. In 1990 and 1991 the CPI rose by 5.5% and 2.7% respectively.

The culprit? Once again money. Through 1990 and 1991 M1 increased by 14.4%.

Oil prices over tripled from 2009 to 2011, from the nadir of the Great Recession into its slow recovery. The inflation rates in 2009, 2010, and 2011 were 2.8%, 1.4%, and 3.1%.

During those same years M1 increased by 5.7%, 8.5%, and 17.9%.

Whatever inflation the country experienced, mild as it was considering the doubling and tripling of oil prices, was due entirely to the central bank’s figurative printing press, not oil.

IS THERE ANY WAY IT CAN BE OIL AT ALL?

OK, so a logical next question might be “Come on Cautious Optimism Correspondent, surely there can be a big enough oil price surge that affects everything else enough to cause high inflation on its own, right?”

Well yes. Although that has never happened in U.S. history, it could happen in theory—just not for the fallacious reasons the media tell us.

Let’s say oil goes to $1,000 a barrel tomorrow. Assuming monetary factors are held constant by the central bank, consumers and businesses who are forced to pay such astronomical prices would again have less money, a lot less money, left to buy everything else, lowering non-oil sector prices accordingly. Ie. no inflation.

That part is still true, but…

The prices of other products would fall so sharply that firms record losses and start cutting back on production.

If the scarcity of oil becomes so acute that the overall economy’s output turns negative, then the “y” variable in the Equation of Exchange—output of goods and services—falls and finally becomes inflationary. That is, oil as an input becomes so scarce that some businesses somewhere can’t get enough of it to support their operations and are forced to cut back supply.

Now we have the same number of dollars chasing fewer goods.

Economists with a more sophisticated understanding of inflation will sometimes say “If oil prices rise enough to harm output then we could see higher inflation.” That’s a valid mechanism.

Unfortunately the invalid mechanism is the one that gets far too much press today: “If oil prices rise the cost will push through into everything else, raising inflation.”

The first phenomenon can happen in reality. The second cannot, unless once again the central bank inflates the money supply at the same time.

So are oil prices rising quickly enough right now to reduce overall output and drive the high inflation we’re all experiencing?

That’s easy. The answer is no. Because if oil prices were really forcing a pullback in the supply of goods and services for the last year that would meet the official definition of a recession: at least two consecutive quarters of contracting output.

Over the last 12 months Americans have seen prices rising by 6%, then 7.5%, then 8.5%, but output and real GDP haven’t been contracting. They’ve been rising. High oil prices driving output into reverse is not the culprit.

The fact that the U.S. economy has spent 90% of the last 40 years in expansion also automatically disqualifies 90% of recent history from any conversation where economists might try to blame higher oil prices for inflation.

OK, admittedly we did get a surprise last week: the BEA reported that GDP contracted by a 1.4% annualized rate in the first quarter (equal to -0.35% for the single quarter), so we may be on the cusp of entering a recession soon. But one recent quarter can’t explain an entire year of rising prices, and it’s mathematically impossible for an 8.5% annualized increase in prices to be caused by only a 1.4% annualized reduction in output.

In 2022 the culprit once again is money. In the last twelve months the money supply measured by the Fed’s new definition of M1 has increased by 11.1%, something you’ll never hear Jen Psaki mention.

So it starts to become clearer now why Milton Friedman famously said:

“Inflation is always and everywhere a monetary phenomenon, in the sense that it is and can be produced only by a more rapid increase in the quantity of money than in output.”

Note: All data sources from the St. Louis Federal Reserve. Anyone who wants links to any of the M1, velocity, CPI, or real GDP indexes can request it in the comments section.