Click here to read the original Cautious Optimism Facebook post with comments
5 MIN READ - The Cautious Optimism Correspondent for Economic Affairs and Other Egghead Stuff continues his mini-series on understanding GDP.
 |
| Nominal and PPP GDP yield different results |
ANNUALIZED GDP
As we continue our examination of GDP as a measurement tool, a quick word about quarterly and annualized GDP figures.
When the Bureau of Economic Analysis releases a quarterly GDP report with headlines like “Economy Grew at 3% Pace in Second Quarter,” the 3% number is annualized. That is, the economy only grew about one-quarter as fast as 3% but the BEA reports an annualized number that assumes the same quarterly rate of growth continues for three more quarters. This makes the final number easier to understand for readers.
Most people would prefer a headline that reads “grows at 3% annualized pace” than “grows at 0.75% quarterly pace.”
Incidentally the assumed growth over four quarters is compounded so technically 3% annualized isn’t quite 0.75% per quarter. If one compounds 0.75% growth over four quarters the annualized result is actually slightly higher than 3% (1.0075 * 1.0075 * 1.0075 * 1.0075 = 1.030339), or +3.03%.
Such a tiny difference may not mean much, but when dealing with larger numbers the differences can stack up, namely during the recent Covid crisis.
When the state governments shut down economies across the country in the second quarter of 2020, the BEA reported that GDP contracted by 34.3%.
We now know that’s an annualized number so one might assume the real rate of contraction for the quarter itself was 34.3 divided by 4 or -8.575%.
In fact, the quarterly contraction has to be compounded four times, so although the math is a little weird the formula is actually
(1-.343)^(1/4) = .9003
...or a quarterly contraction of -9.97%, not -8.575%.
Likewise when the economy reopened in the third quarter, the much less widely reported headlines read that GDP rose by 33.4%.
Once again, 33.4% is annualized, assuming the quarterly rate of growth compounds over four quarters total. So using our compounded math the economy really grew 1.334^(1/4) = 1.0747 or 7.47% that quarter.
Down 9.97% in Q2, up 7.47% in Q3. In one quarter the economy clawed back most of what it had lost, but not all.
OTHER COUNTRIES: NOMINAL GDP
Occasionally the Economics Correspondent will read a headline that “China has the world’s largest economy measured by purchasing power parity.”
As you might guess, this headline is pretty misleading. China does not have the world’s largest economy (although it is safely #2).
The source of confusion is that economists use two different measures of GDP, especially when comparing different countries: nominal versus purchasing power parity or PPP.
The easiest way to think of these two is:
“Nominal” is the best measure of the actual value of all products and services produced by an economy. On that measure the United States remains #1 at $28.78 trillion versus China at $18.53 trillion (IMF).
"PPP" takes nominal GDP and adjusts it for cost-of-living in each country. So while the USA might produce more stuff and more valuable stuff than China, it still costs Chinese less to live in China than it costs Americans to live in the USA.
But when comparing U.S. output to Chinese output the Economics Correspondent thinks it’s useless to work with PPP and divide by U.S. or Chinese cost-of-living. Nominal is what matters which indicates the USA still outproduces China.
To see the difference in U.S./Chinese nominal vs PPP GDP, see the following links:
https://en.wikipedia.org/wiki/List_of_countries_by_GDP_(nominal)
https://en.wikipedia.org/wiki/List_of_countries_by_GDP_(PPP)
So why use PPP at all?
PPP GDP
Because PPP does still play an important role in measuring "per-capita" GDP.
On a nominal basis U.S. per-capita GDP, or output per citizen, ranks #6 in the world at $85,373 (IMF) and is easily the highest of any country with any meaningful population (Monaco, the Caymans, Singapore, and even Ireland, all of which rank higher than the USA, are small countries with at most 5.9 million people).
China, which has far more people than the USA, falls to #69 at $13,136 on a per-capita basis (IMF). This is where the phrase “American workers are among the most productive in the world” comes from: the United States still produces a lot more valuable stuff per worker, and per citizen, than China and most other countries.
However, it still costs a lot less to live in China, so adjusting with PPP gives us a clearer picture of the material standard of living for a nation’s citizens. By nominal measure Americans produce 6.5 times more stuff per person than Chinese, but PPP tells us Americans don’t enjoy a 6.5 times higher living standard.
Using PPP, U.S. per-capita remains $85,373 but Chinese per-capita GDP rises to $25,015. So a more accurate picture of living standards tells us Americans are about 3.4 times richer than Chinese. Still a lot better, but not 6.5 times richer.
To see the difference in U.S./Chinese nominal vs PPP per-capita GDP, see the linked photos:
Per-capita GDP nominal
https://image.cnbcfm.com/api/v1/image/106859827-1616735644553-US-China_GDP_per_capita.png
Per-capita GDP PPP
https://mgmresearch.com/2018/12/China-vs-US-GDP-PPP-per-capita-comparison.png
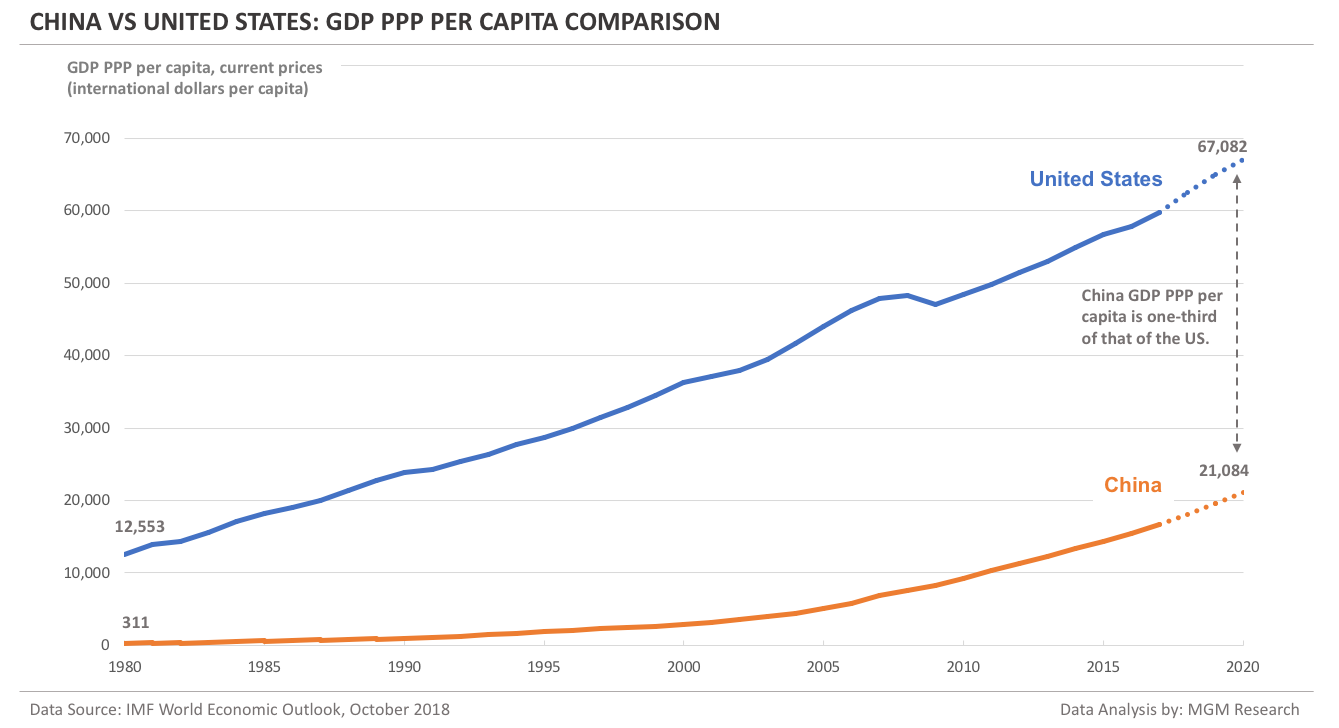
Bottom line? When comparing how much one country produces against another, use nominal GDP.
When comparing how high a living standard one country’s citizens reap from economic production against another country’s citizens, use PPP per-capita GDP.
And ignore articles and charts that compare U.S. GDP to Chinese GDP using PPP metrics. They are meaningless when stacking two entire countries' economies next to one another.
One final complication about comparing countries. Nominal GDP is the best metric to use, but it’s not perfect.
U.S. GDP is measured in dollar spending on consumption, business investment, government purchases, and net exports. But, say… Japanese GDP is measured in yen spending on those same variables.
So we are now comparing a dollar-based metric with a yen-based metric, aka. apples and oranges.
To convert to an apples-to-apples comparison economists simply adjust by the going currency exchange rate. This is not a bad thing since, although the exchange rate fluctuates, currency markets adjust largely based on the perceived economic output of each country.
So if Japan were to go into a depression and produce 50% less stuff while leaving the money supply constant (leading to a doubling in prices) the Japanese nominal spending numbers might look like U.S. vs Japanese GDP hasn't changed much when in fact Japan’s real GDP is half what it was.
But currency markets would notice the Japanese inflation and the U.S. dollar would strengthen—by somewhere around double—against the yen. Hence Japan's dollar-denominated GDP would be halved (adjusted by a far more favorable exchange rate for the dollar) and in nominal terms U.S. GDP would accordingly look a whole lot bigger than Japan’s, and far bigger than it was a year prior.
Where this can lead to complications is central bank exchange rate manipulation. If a government is intervening in currency markets and manipulatively undervaluing its currency—something China did a great deal of 15-20 years ago and still does occasionally today—Chinese GDP would appear slightly smaller than it really is. This is why 15-20 years ago economists argued Chinese GDP was probably somewhat higher than the nominal numbers indicated.
Likewise if a country is overvaluing its currency, as Venezuela has for decades and Argentina did up to Javier Milei’s election victory, the currency adjustment will make Venezuelan or Argentinian GDP look stronger than they really are.
Yes, all along Venezuela's nominal GDP has been even worse than it appears, and that's before the socialist government starts lying.
In extreme cases like Venezuela and Argentina the resulting nominal GDP numbers were way off, but economists took into account the overvaluation and adjusted their GDP estimates to be more realistic. But in cases of modest undervaluation, such as China or Japan today, the GDP adjustment is pretty small.
No comments:
Post a Comment
Note: Only a member of this blog may post a comment.