Click here to read the original Cautious Optimism Facebook post with comments
7 MIN READ - From the Cautious Optimism Correspondent for Economic Affairs and Other Egghead Stuff.

Anyone who’s read even a few left-leaning articles about “income inequality” has probably heard or seen it: “Worker pay has been flat since 1980 while companies have logged huge gains in productivity.”
The attached chart (left) and countless others like it are circulated endlessly around the Internet by apostles who declare it undeniable proof that evil CEO’s and shareholders are reaping all the benefits of higher productivity while workers are getting shafted. Of course the proposed solution is always higher taxes on wealthier Americans and more government wealth redistribution.
But the reality is since 1980 worker compensation has slightly outpaced productivity gains, provided one measures what workers get and what companies get honestly.
Which means using proper (not just politically useful) metrics: worker compensation vs multifactor productivity. Because “wages vs productivity” is an erroneous comparison of epic proportions which assumes:
1) Companies pay zero for their employees’ fringe benefits, and more critically…
2) Companies pay zero to achieve all their productivity gains.
COMPENSATION, NOT WAGES
The first mistake in both this left-wing thesis and their charts is to measure workers’ share of productivity gains by "non-supervisory wages."
OK, “wages” aren’t the same as “compensation.”
What a statistic like “wages” ignores is the growing role of fringe benefits in employee compensation over the last half century. Counting wages alone ignores the substantial expense companies incur to subsidize private health insurance for employees and their families, dental and vision insurance, life insurance, and other coverages for long-term disability or accidental death.
Many companies also pay sick leave and free maternity leave for hours not worked, college tuition assistance, for employee assistance programs, childcare benefits, and financial planning resources.
Compensation can also include 401k retirement plan matching contributions and stock options. The Economics Correspondent doesn’t know if retirement/pension funding are included in the left’s mainstream “wages” graph, but will wager a good bet that they aren’t.
Granted, it’s true these benefits aren’t cash payments, and the Economics Correspondent thinks it’s a sad statement of our times that employers have to pay out so much worker compensation in the form of health insurance instead of higher paychecks.
(That’s the result of decades of government policy/regulations driving up healthcare costs—more about that in another column)
But what can’t be denied is that these benefits cost companies a lot of money, and the costs are completely excluded from liberal charts that allegedly “prove” they are paying no more to their workers than they did forty years ago.
Another manipulation is to exclude supervisory pay and compensation which, by omitting higher earning workers, artificially lowers the slope of the “wages” graph.
The same people who promote these charts would like Americans to believe supervisory workers shouldn’t be counted because the skyrocketing pay of greedy, overpaid corporate executives misleadingly portrays an improving picture for the other 99%.
But the reality is “supervisory personnel,” whose wages are rising faster than nonsupervisory personnel, means anyone who oversees, hires, or fires workers. That’s store managers at countless McDonalds, Subway, Starbucks, or other restaurant or retail stores across the country. It means the motel front desk manager, the local landscaper who recruits hired hands, or mom and pop owners of local hardware or arts and crafts stores—effectively many millions of people.
These supervisory workers vastly outnumber CEO’s and, even with large CEO and executive pay packages, the collective compensation of this enormous pool of workers means they have a far greater impact on rising overall compensation than a handful of corporate suits.
Leaving them out further falsifies the compensation picture.
Of further consequence is that wages of millions of non-supervisory employees have been artificially dampened by the introduction of tens of millions of illegal immigrants who have depressed pay for less skilled workers. Yet the mass influx of lower-skilled, wage-suppressing illegal immigrants is championed by the very people circulating charts that “prove” corporations are ripping off workers.
So the use of “wages only, and only for non-supervisory workers” data distorts the picture of worker compensation in multiple, insidious, and disingenuous ways.
MULTIFACTOR PRODUCTIVITY, NOT PRODUCTIVITY
But manipulation of employee compensation data looks insignificant when compared to the greatest misrepresentation of all: using productivity to portray companies as making gigantic gains in output—and presumably sales—while leaving workers in the dust.
Because “productivity” assumes companies achieve all those output gains for free.
The Bureau of Labor Services defines labor productivity as:
“Output per hour of labor.”
...a fairly simple concept that most people understand.
But the BLS defines the much more relevant metric of "multifactor productivity" (sometimes also known as “total factor productivity”) as:
“A measure of economic performance that compares the amount of output to the amount of combined inputs used to produce that output. Combinations of inputs can include labor, capital, energy, materials, and purchased services.”
In other words, multifactor productivity equals productivity gains minus costs to achieve them.
The forty-year trend line in such charts omits completely the literally tens of trillions of dollars in ceaseless business investment and upgrading of capital tools, machines, and factories or even the increase in compensation they pay workers to achieve those gains, one of the factors left-progressives have such alleged grievances with in the first place.
They may as well chart out a line for “revenues” and call it “profits” since in their world there are zero costs.
A single example of adjusting for multifactor inputs is the gains in output from land-based oil rig workers over the last decade.
With improvements in drilling rig technology, horizontal drilling techniques, smart drill bits, and geological computer analysis, an oil and natural gas contractor can drill and complete a well in a fraction of the number of days it used to take even a decade ago. This allows the company to charge a slightly higher dayrate—market competition allowing—while paying fewer worker hours to achieve the same quantity of output, i.e.. higher productivity.
And that's what liberal activists put in their charts: the company pocketing all those gains and paying nothing to achieve them.
But that’s a ridiculous assumption. A new, modern onshore drilling rig with all the technological bells and whistles needed to achieve those gains can cost over $100 million... for one rig. Now multiply that by the over-270 rig fleet for leading U.S. contract driller Helmerich & Payne alone.
The typical “wages vs productivity” fiction floating around the Internet not only pretends those costs don’t exist, it also ignores many other peripheral costs such as transportation of workers to the remote site, lodging, food and laundry services, energy consumed to operate the drill site, maintenance of the rigs, chemicals, water, etc. and yes, the rising annual compensation for the workers themselves.
One might as well claim airlines pay zero to procure new $250 million fuel efficient aircraft, semiconductor companies pay zero for new $15 billion fab plants, and wireless carriers pay zero for multibillion dollar network and nationwide cell tower upgrades.
One very technical note: when it comes to capital expenditures, multifactor productivity only accounts for depreciation. An oil driller might spend $100 million on a new rig, but if they can sell it eight years later for $25 million then only $75 million is factored into MFP. That’s the fairest measure of capital expenditure, but once again mere “productivity” throws even the $75 million in capital depreciation out too.
REAL MATH AND REAL TRAGEDY
So if we chart the two statistics that truly reflect the real state of multifactor productivity growth and worker compensation in the U.S. economy, we get a very different picture (see right diagram attached).
Workers are doing a lot better than we’re told, and their total compensation in real terms has slightly outpaced multifactor productivity since 1980.
There is, however, one tragedy that has consistently worked against employees for decades.
Although worker productivity and compensation have both risen steadily, Americans have sadly been forced to “trade away” more and more of those gains for their three most rapidly escalating costs of living: housing, healthcare, and college education. Not only have these three purchases traditionally been the most expensive for everyday consumers (right after income taxes), but uncoincidentally they’re also three of the most heavily government-regulated sectors of the economy.
Healthcare inflation has manifested itself in that very flattening “wage” graph because real cash raises have been heavily displaced by the rising cost of employer-paid health insurance.
College education costs have skyrocketed as the federal and state governments have subsidized students to the tune of hundreds of billions of dollars, prompting colleges to simply raise tuition, room, board, and books in tandem. In economics terms we say the government has pushed the demand curve to the right (see URL image).
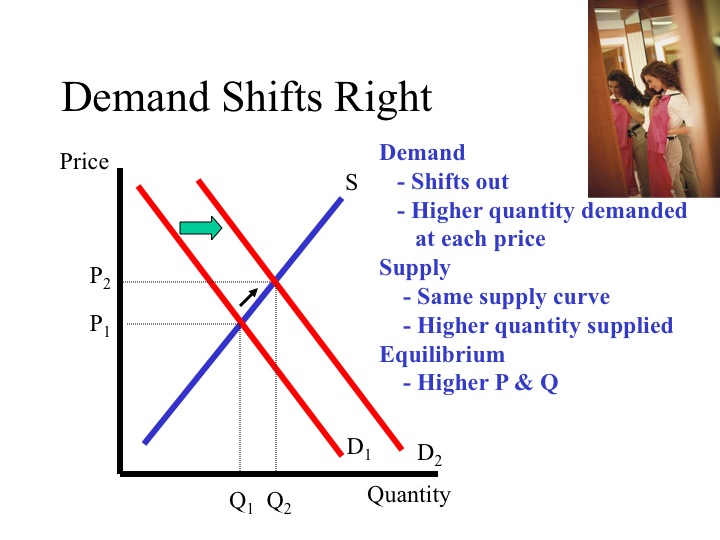
The federal government's nationalization of the student loan industry market over a decade ago hasn’t helped either.
And blue states, and particularly blue cities, have clamped down on homebuilding with restrictive zoning laws and construction moratoriums, artificially limiting the supply of housing as demand relentlessly rises. Years of Federal Reserve-generated zero interest rates has ballooned the amount homebuyers can borrow, so demand has exploded while supply has been capped.
A worker’s productivity and pay can multiply tenfold, but if no new housing construction is allowed then workers trade away most of those gains in the bidding war that ensues for the government-imposed limit on available units.
That’s the real tragedy that has hurt workers: U.S. companies have done their job and employed ingenious ways to produce more with less labor, and workers have shared in those gains. But government interventions in the important consumer sectors of housing, healthcare, and college education have forced workers to sacrifice nearly all those gains to the artificial “rat race” created by state-imposed scarcity.
For those who wish to adjust the date windows at the Federal Reserve chart website, you can go to:
No comments:
Post a Comment
Note: Only a member of this blog may post a comment.