Wednesday, October 28, 2020

Q3 GDP 2020 Forecast to Grow at a Record 35.3% Annualized Rate

"The Atlanta Federal Reserve estimates that GDP will grow at an annualized rate of 35.3% in the third quarter..."

"The Economics Correspondent has access to annual GDP figures going back to 1800... ...Just one quarter after many in the media were predicting another Great Depression the economy is showing resilience with a rebound which, measured by GDP, will set a record going back to before the days of George Washington and Benjamin Franklin."

Analyzing Upcoming Q3 GDP Numbers

Click here to read the original Cautious Optimism Facebook post with comments

As CO readers may have already noticed, the Cautious Optimism Correspondent for Economic Affairs and Other Egghead Stuff doesn’t comment on every single monthly or quarterly jobs, unemployment, GDP, or inflation report.

But these are historic times. The arrival of Covid, government lockdowns, and then economic reopenings has generated wild swings in the economic indicators that we may not see again in our lifetimes.

Therefore it’s worth putting Thursday’s upcoming Q3 GDP report into perspective.

Q3 GDP ESTIMATE

The Atlanta Federal Reserve estimates that GDP will grow at an annualized rate of 35.3% in the third quarter.

https://www.fxstreet.com/news/atlanta-feds-gdpnow-edges-lower-to-352-for-q3-after-us-data-202010091640

You’re not misreading that. It’s not 2% which was so common during the Obama years, or 3% as we typically saw during the first three years of the Trump administration.

It's +35.3%, with twenty other forecasting institutions averaging a lower estimate of about +29%.

Keep in mind +35.3% is an annualized growth rate, meaning real GDP actually grows 7.85% for the quarter (1.0785 ^ 4 = 1.353).

But whichever estimate you use—the Atlanta Fed’s or the private forecasters'—these are simply historic numbers.

The Economics Correspondent has access to annual GDP figures going back to 1800—using academic scholarly estimates up to 1944 and official government statistics afterwards. Let’s compare +35.3% annualized per quarter to past records:

Quarterly: GDP statistics by quarter are only available starting in 1947 and the record stands at 16.7% in Q1 of 1950 when the USA was coming out of a recession. 

Going back before 1947 the Economics Correspondent’s best guess for a potential rival would be the second quarter of 1933, right after the great banking Panic of 1933 (February/March). The government’s March audit of the nation’s banks and mass return of deposits by bank customers launched a strong economic comeback that was abruptly squelched that fall by Franklin Roosevelt’s National Recovery Act.

Annual: GDP by year is more interesting. Unsurprisingly the highest gains are in wartime when the government engages in large military purchases. However, wartime GDP is misleading since private GDP often suffers as government spending “crowds out” private consumption and investment spending.

Consistent with this problem is 1942, officially the highest year at +18.9% GDP growth and 1943, the next highest at +17.0%. Unsurprisingly these were the first two full years of America’s involvement in World War II, and just as predictably private sector GDP was negative in both years. So even though 3Q20 eclipses both, it’s not suitable to compare “mostly peaceful protesters” 2020 to wartime 1942 and 1943.

Thus the strongest year of private GDP growth in American history was 1946 at +18.7%. Ironically this is the same year the federal government drew down wartime spending resulting in an official GDP loss of -15.8%, but in fact it was the greatest year of private sector economic growth in American history.

Readers who are curious about the economics of the World War II spending drawdown and 1946 boom can read the Correspondent's 2019 article at:

http://www.cautiouseconomics.com/2019/07/the-great-depression-16.html

But for now let’s compare these records to 3Q20.

An annualized gain of +35.3% is greater than double the previous quarterly record of +16.7% in 1950, and nearly double the greatest private sector annual record of +18.7% in 1946.

And it’s important to note that since +35.3% is an annualized figure, the economy would have to sustain an impressive double-digit annualized rate of growth for three more quarters to compare suitably with the entire year of 1946.

But by any measure, 35.3% annualized GDP growth in one quarter is an off the charts, unprecedented record.

REALITY AND MEDIA SPIN

So the Economics Correspondent is willing to bet his next year’s salary that when these numbers are released, the media will immediately try to spin them like wet laundry.

Fearing any good news that might reflect positively on Donald Trump and detract from their campaign's chances of victory, the Correspondent predicts any combination of these headline narratives:

1) “GDP growth lower than expected”

2) “GDP up but expected to slow”

3) “GDP up but millions still out of work”

4) “GDP growth misleading because it follows a revised -31.4% annualized loss in Q2”

5) Blackout. Or bury the story at the bottom of page B7.

Nowhere in the headlines will we see the words “record” or “historic” or “unprecedented” unless it’s in conservative leaning outlets such as Fox News or the Wall Street Journal.

But regarding the fourth and final “spin,” there is actually a lot of truth to the argument that +35.3% growth is simply digging out of the hole of the -31.4% annualized contraction of the previous quarter.

No one seriously believes the economy will be 35% larger this Christmas than it was last Christmas, so it’s true that there was a huge drop in Q2 followed by a huge bounce in Q3. An economy starting at an index of 100 that loses 9.0% for the quarter (-31.4% annualized) and then gains 7.9% the next quarter (+35.3% annualized) settles at 98.2, not 135.3.

And of course there are more quarters to come post-election which will probably raise the index further. 

Well, the index will rise assuming a giant Covid autumn/winter second wave doesn’t produce a negative enough affect on consumer behavior or worse yet a return to economic lockdowns. Most economists think the result would be a slowdown of the recovery, not a reversal, but it all depends how bad the new cases and how bad the local/state government restrictions get.

But despite the media’s likely spin that it’s only a bounce after a giant contraction, the key point is that there *is* a bounce—a gigantic, record bounce.

Just one quarter after many in the media were almost gleefully predicting another Great Depression the economy is showing resilience with a rebound which, measured by GDP, will set a record going back to before the days of George Washington and Benjamin Franklin. It’s already broken records for the pace of reduction in the unemployment rate.

Contrast the current 2020 rebound with the “recovery” under Barack Obama where the media declared him the Messiah when an isolated quarter came in at 5%, but the average over his eight years was more like 2.2% in which case it was the fault of Congressional Republicans.

Yes, yes, Obama had a real structural recession in 2009 and Trump has an economy that was artificially put to sleep and then woken back up. Yes, they are two completely different kinds of recessions, but few in the media will even try to make that distinction because it will mean first acknowledging that the economy has woken up with a vengeance in the first place.

So CO Nation will have to read it right here because you won’t get it from CNN or The New York Times. If Q3 GDP numbers are anywhere in the ballpark of the forecasts, it will be validation that the economy is rebounding from Covid-related lockdowns with a strength never before seen.

But instead we’ll probably see negative headlines about malaise, joblessness, and suffering.

And inequality. You're supposed to never, ever forget about inequality.

Saturday, October 17, 2020

Inflation and Deflation Fallacies Part 3: Why So Many Economists Get Deflation Wrong

 Click here to read the original Cautious Optimism Facebook post with comments

4/6 MIN READ - The Cautious Optimism Correspondent for Economic Affairs and Other Egghead Stuff continues discussing inflation and deflation fallacies by explaining why so many economists just don’t understand deflation.

As we demonstrated in the Correspondent’s previous installment on deflation, zero inflation or gently falling prices don’t cause or prolong recessions and depressions. And the USA has 138 years of history before 1914 to prove it, when prices gently fell throughout and the economy grew at breakneck speed into the world’s largest.

You can read that article at:

http://www.cautiouseconomics.com/2020/09/inflation-currencies06.html

But in the meantime, how then could so many mainstream economists and the media (restrain laughter) get deflation so wrong?

As monetary economist George Selgin of the CATO Institute never tires of explaining, most economists don’t understand the difference between good deflation and bad deflation.

V. CLEARING UP THE THEORETICAL MISTAKE: BAD (VERSUS GOOD) DEFLATION

So what’s bad deflation?

Bad deflation is rapidly falling prices associated with a catastrophic shock to demand, typically the result of the many banking crises that occurred throughout the 19th century and during the Great Depression.

When banks fail in large numbers their demand deposit (ie. checkbook) balances become worthless and the money supply suffers a sudden contraction. Furthermore, during a crisis even surviving banks tighten up credit and curtail lending—a measure to conserve scarce reserves. 

As debtors pay back debts but no new loans are made, the money supply further contracts, so all other things being equal prices fall.

The most famous case of bad deflation, which virtually all mainstream economists cite, is the 1930-1933 period of the Great Depression when 10,000 U.S. banks failed, the money supply shrank by one-third, and prices fell a whopping 10% per year on average for nearly four years.

In a deflation that extreme, not only were prices falling very rapidly but the bank failures themselves and associated drying up of lending harmed the economy even more. In other words, it wasn’t so much falling prices themselves that were tanking the economy, but rather a collapsing financial system. Rapid price deflation, while certainly problematic, was as much a consequence as a cause of depression.

In such a scenario debt can also becomes a problem since debt payments are fixed in nominal terms but prices and wages quickly fall so more borrowers default, placing even more strain on the credit system.

This is pretty much all most economists think of when they consider falling prices. They're taught, and believe, that deflation of any kind must necessarily produce Great Depression conditions.

VI. BAD DEFLATION MAY NOT BE QUITE THAT BAD AFTER ALL

Yet as bad as the 1930’s deflation scenario is, assumptions about the extent of its malignance have to be questioned because there is historical precedent of rapid deflation that didn’t produce a Great Depression.

After the mostly-forgotten Panic of 1839, prices also fell by even more than one-third over four years in a deflation that exceeded the Great Depression’s. 

But the macroeconomic results were quite different then. As Professor Jeffrey Rogers Hummel of San Jose State University writes:

“During the Great Depression, as unemployment peaked at 25 percent of the labor force in 1933, U.S. production of goods and services collapsed by 30 percent. During the earlier nineteenth-century contraction [1839-1843], investment fell, but amazingly the economy's total output did not. Quite the opposite; it actually rose between 6 percent and 16 percent. 

"This was nearly a full-employment deflation. Nor are economists at any loss to account for this widely disparate performance. The American economy of the 1930s was characterized by prices, especially wages, that were rigid downward, whereas in the 1840s, prices could fall fast and far enough to quickly restore market equilibrium.”

-“Martin Van Buren: The American Gladstone” by Jeffrey Rogers Hummel

Even mainstream MIT former Economics Department Chair Peter Temin, himself a fairly left-leaning mainstream quasi-Keynesian cites the 1839-1843 experience:

“As some detailed estimates by economic historian Peter Temin show, the contraction in the money supply was even greater in 1839-43 than in 1929-33. The fall in the price level was substantially greater: -31 percent in 1929-33 and -42 percent in 1839-43.

"But consumption in real terms, which decreased by 19 percent in 1929 to 1933 increased 21 percent from 1839 to 1843. More dramatically still the real gross domestic product, which decreased by no less than 30 percent from 1929 to 1933, increased by 16 percent from 1839 to 1843.”

-“The Rise and Decline of Nations” by Mancur Olson

To add color to Professor Hummel’s contrast between the price and wage policies of the 1839-1843 and 1929-1933 periods, the Correspondent would like to add that during the Hoover years of the Great Depression the top federal tax rate was raised from 25% to 63%, taxes on the middle classes raised by over 100%, an international trade war was launched by the Smoot-Hawley Tariff, and federal government spending more than doubled in real terms.

So while the Economics Correspondent doesn’t want to test the theory of 10% annual deflation anytime soon, the stark contrast between the 1839-1843 and 1929-1933 periods suggests free market economies are more resilient to rapidly falling prices than mainstream economists believe. 

An over 40% fall in prices during the 19th century failed to produce a Great Depression because market prices and wages were freely floating and allowed to adjust rapidly.  And 19th century America was free from the crushing government tax and spending hikes, inflexible labor regulations, and global trade wars of the 1930's.

VII. CLEARING UP THE THEORETICAL MISTAKE: GOOD DEFLATION

However there is a “good” kind of deflation too, and it dominated the 19th century with the exception of several banking panics that occurred on average every dozen years.

Good deflation occurs when the economic output is growing faster than the money supply. 

During the 19th century the United States was on a bimetallic (gold and silver) standard until 1879 when it joined the industrialized world on the monometallic classical gold standard. But in both cases, the money supply was closely linked to precious metal reserves and the pace of new mining discoveries thus limiting the rate of monetary expansion.

If, for example, the economy produced 5% more goods and services one year but the money supply, constrained by the gold standard, grew by only 4%, then assuming constant velocity the price level fell roughly 1% (104 units of new money divided by 105 new units of product = 99.05% the previous price level).

Quite the opposite from the bad deflation scenario, good inflation is associated with strong economic growth. Clearly the faster the economy grows the further prices will fall provided money growth remains restrained, or in the Equation of Exchange mv = py, rising output ( y ) results in a lower price level ( p ), all other variables being equal.

In real world practice this produced benign, gentle deflation during the Gilded Age. Annual prices fell a little slower than 1% on average from 1865 to 1914, and far from a half-century Great Depression America experienced the fastest half-century of economic growth in its history.

Unfortunately most economists are taught in school that depression is simply associated with deflation, particularly the Great Depression. They also look at the recessions and depressions of the 19th century and notice an accompanying fall in prices—a trend present throughout the entire century, not just during slumps—and conclude deflation must have caused those downturns.

Well correlation is not causation, as deflation was the norm during both economic booms and economic busts during the pre-Fed era.

And one mustn’t underestimate the impact of living in an academic and media echo chamber, where large numbers of intellectuals and reporters simply recycle the myth among themselves. 

The myth, repeated enough times, becomes the truth, although the Economics Correspondent doesn’t let academia in particular off the hook. It’s their job to thoroughly research the theory and history before opining. Too many don’t.

====OK, stop reading here unless you are an econ nerd seeking a more detailed (wonkish) analysis.====

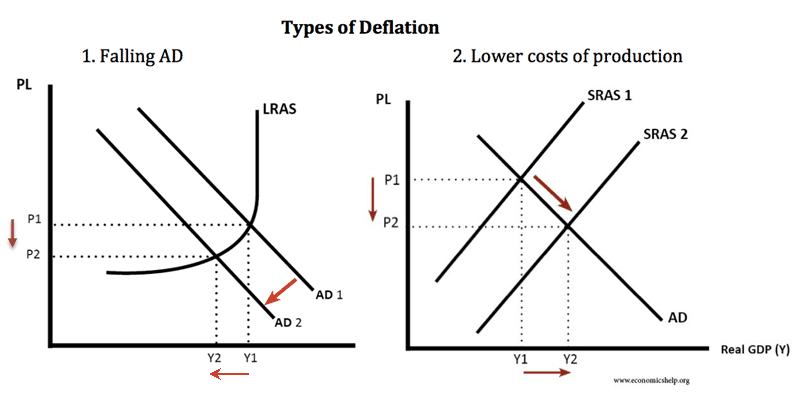
ps. See attached visual model of good vs bad deflation.

https://www.economicshelp.org/wp-content/uploads/2017/11/types-of-deflation-1.png

Model 1 (“Falling AD”) is a graph of bad deflation resulting from a sudden demand shock, usually the result of a banking crisis and contracting money supply. The quantity (x-axis) of demand represented by curve AD1 shifts left to lesser demand curve AD2. Thus the intersection with long-run aggregate supply curve LRAS moves down the price or y-axis from P1 to P2 resulting in lower prices.

Model 2 (“Lower costs of production”) is a graph of good deflation resulting from capital investment and higher productivity which raises output of goods and services per unit of labor. The quantity (x-axis) of aggregate supply represented by curve SRAS1 shifts right to greater supply curve SRAS2. Thus the intersection with aggregate demand curve AD moves down the price or y-axis from P1 to P2 resulting in a lower prices.

There is absolutely nothing wrong with Model 2 as it was the real-world norm during the spectacular growth periods of the Industrial Revolution and American Gilded Age. In fact good deflation would be the norm today were it not for central banks producing new money at a rate faster than the growth of goods and services in a deliberate policy of eternal price inflation.

In the “bad deflation” environment, government intervention has historically made things much worse. If the government forces prices back to P1 (price and wage floors such as those during the Great Depression) a gap or “surplus” in quantity appears between new demand curve AD2 and supply curve LRAS. That gap—follow dotted-line P1 between AD1 and AD2—in quantity applies to both goods and services and particularly labor. 

Hence as aggregate demand fell during the Great Depression and the government forced wages up to old price level P1, the supply of labor at LRAS/P1 exceeded the demand for labor at AD2/P2, and the surplus was manifested as double-digit unemployment for a decade that peaked above 25% in 1933.

Thursday, October 8, 2020

Wuhan Institute of Virology 2015 Paper: "We Created a Chimeric Virus... ...from Chinese horseshoe bats... ...in primary human airway cells and in vivo."

Click here to read the original Cautious Optimism Facebook post with comments 

1. Chimeric (adj): relating to or denoting a DNA molecule with sequences derived from two or more different organisms, formed by laboratory manipulation.

2. "…we built a chimeric virus encoding a novel, zoonotic CoV spike protein—from the RsSHC014-CoV sequence that was isolated from Chinese horseshoe bats... ...Using this approach, we characterized CoV infection mediated by the SHC014 spike protein in primary human airway cells and in vivo."

-Dr. Shi Zhengli, et al. (2015 research paper on Wuhan Institute of Virology bat coronavirus research)

Wuhan Institute of Virology bat coronavirus expert Shi Zhengli

4 MIN READ - The Cautious Optimism Correspondent for Left Coast Affairs and Other Inexplicable Phenomena thanks CO Nation regulars Don Deere, Ticiba Upe, and others for sending him down the investigatory road that led to the discovery of this 2015 scientific paper detailing bat coronavirus re-engineering experiments at the Wuhan Institute of Virology.

The Correspondent has extracted key passages from this open 2015 scientific paper (link and excerpts at end of column). The text reads somewhat technically, but with a little persistence one can clearly see what the joint Chinese-western team was trying to accomplish, including “batwoman” Shi Zhengli, China's top authority on bat coronaviruses.

In layman terms, they were concerned that one day a bat coronavirus might jump naturally to humans and create another 2003 SARS-like outbreak.

So to head off such an eventuality they decided to genetically alter a natural coronavirus from the horseshoe bat to enhance its ability to infect mammals via the ACE2 receptor and then test various antibody therapies on it to stockpile effective treatments in case such a future outbreak might occur.

They also tested the genetically altered coronaviruses on human lung tissue and were pleased with the results. The artificial coronavirus proved quite adept at penetrating lung tissue and replicating.

However some western scientists expressed concern that the risks of such experiments far outweighed any potential benefits should the chimeric virus “escape.” In other words, their risky research to head off a future outbreak might create the outbreak itself.

The Left Coast Correspondent is no fan of paranoid conspiracy theories that instantly circulate at the first onset of every crisis, but over time more and more circumstantial evidence has emerged providing a growing list of implausible coincidences.

Each single coincidence was already somewhat dubious on its own, but as more and more are added to the long chain of coincidences the shrinking probabilities relentlessly build a circumstantial case that Covid-19 was artificially conceived at the Wuhan Institute of Virology as a superefficient human infector for benign albeit unwise reasons.

In other words, once in a while a conspiracy theory turns out to have merit.

The unlikely chain of coincidences includes:

-The outbreak started in Wuhan, the same city where the experiments were conducted.

-The original Covid-19 coronavirus originates in a species of bat that lives 500 miles away from Wuhan.

-All cell phone voice and data traffic dropped to zero at the Wuhan Institute of Virology from October 7-24 of 2019, consistent with a shutdown if Chinese authorities suspected a leak.

-The Covid virus is superefficient at infecting humans, something unusual for viruses that have just made their first natural jump. Natural viruses typically need years/decades of mutations to perfect the process, but Covid-19 hit the ground blazing through the planet's human population effortlessly. By contrast the SARS and MERS coronaviruses quickly burned out because they couldn’t infect more humans easily enough.

-A Chinese virologist has defected to the United States claiming the Covid-19 coronavirus is chimeric and was engineered at the Wuhan Institute of Virology.

-Scientific papers still exist online confirming the reengineering of bat coronaviruses was taking place at the Wuhan Institute of Virology for the expressed purpose of making them highly infectious to mammals and human lung tissue.

-China’s “batwoman” Shi Zhengli has made public statements denying the Covid-19 virus is related to the viruses her team was working on at the WIV, her words and mouth movements obviously connected to puppet strings tugged by her ventriloquist: the Chinese Communist Party. Communist precedent exists with Soviet scientists we now know were ordered to lie to the world about the 1979 Sverdlovsk laboratory anthrax outbreak. 

-The Chinese government prohibited any WIV access to outside experts until finally providing NBC News a sanitized tour and controlled interview in August of 2020, more than eight months after the initial outbreak at Wuhan's Huanan Seafood Market.

-The Chinese government has hidden away WIV scientists and technicians, putting them out of reach from international experts and journalists. Only a few prepared statements and controlled interviews with state run Chinese media have been allowed, and what few western scientific inquiries are answered have been funneled through WIV Director General Wang Yanyi, an immunologist who has ascended to the Director General post through a combination of her scientific credentials, loyalty to the Communist Party, and political shrewdness adhering to official CCP narratives.

Yet the Chinese Communist government insists these are all coincidences and that the Covid outbreak is completely natural in origin.

Links to the paper and article about scientific dissent are included below as well as the key passages including multiple instances of the words “chimeric virus.”

==========

https://www.nature.com/articles/nm.3985

“The emergence of severe acute respiratory syndrome coronavirus (SARS-CoV) and Middle East respiratory syndrome (MERS)-CoV underscores the threat of cross-species transmission events leading to outbreaks in humans. Here we examine the disease potential of a SARS-like virus, SHC014-CoV, which is currently circulating in Chinese horseshoe bat populations1. Using the SARS-CoV reverse genetics system2, we generated and characterized a chimeric virus expressing the spike of bat coronavirus SHC014 in a mouse-adapted SARS-CoV backbone. The results indicate that group 2b viruses encoding the SHC014 spike in a wild-type backbone can efficiently use multiple orthologs of the SARS receptor human angiotensin converting enzyme II (ACE2), replicate efficiently in primary human airway cells and achieve in vitro titers equivalent to epidemic strains of SARS-CoV.”

“Evaluation of available SARS-based immune-therapeutic and prophylactic modalities revealed poor efficacy; both monoclonal antibody and vaccine approaches failed to neutralize and protect from infection with CoVs using the novel spike protein.”

"However, sequence data alone provides minimal insights to identify and prepare for future prepandemic viruses. Therefore, to examine the emergence potential (that is, the potential to infect humans) of circulating bat CoVs, we built a chimeric virus encoding a novel, zoonotic CoV spike protein—from the RsSHC014-CoV sequence that was isolated from Chinese horseshoe bats1—in the context of the SARS-CoV mouse-adapted backbone. The hybrid virus allowed us to evaluate the ability of the novel spike protein to cause disease independently of other necessary adaptive mutations in its natural backbone. Using this approach, we characterized CoV infection mediated by the SHC014 spike protein in primary human airway cells and in vivo, and tested the efficacy of available immune therapeutics against SHC014-CoV."

"...bat Ace2 sequence was based on that from Rhinolophus leschenaulti, and DBT cells expressing bat Ace2 were established as described previously8. Pseudotyping experiments were similar to those using an HIV-based pseudovirus, prepared as previously described10, and examined on HeLa cells (Wuhan Institute of Virology) that expressed ACE2 orthologs. HeLa cells were grown in minimal essential medium (MEM) (Gibco, CA) supplemented with 10% FCS (Gibco, CA) as previously described24. Growth curves in Vero E6, DBT, Calu-3 2B4 and primary human airway epithelial cells were performed as previously described."

https://www.nature.com/news/engineered-bat-virus-stirs-debate-over-risky-research-1.18787

"other virologists question whether the information gleaned from the experiment justifies the potential risk. Although the extent of any risk is difficult to assess, Simon Wain-Hobson, a virologist at the Pasteur Institute in Paris, points out that the researchers have created a novel virus that “grows remarkably well” in human cells. “If the virus escaped, nobody could predict the trajectory,” he says."

""The only impact of this work is the creation, in a lab, of a new, non-natural risk,” agrees Richard Ebright, a molecular biologist and biodefence expert at Rutgers University in Piscataway, New Jersey. Both Ebright and Wain-Hobson are long-standing critics of gain-of-function research."

Monday, September 28, 2020

Long Term Inflation or How Today’s Governments Will Never Pay Their National Debts Back Honestly

Click here to read the original Cautious Optimism Facebook post with comments 

6 MIN READ - The Cautious Optimism Correspondent for Economic Affairs and Other Egghead Stuff looks at the very real prospects for higher inflation over the long-term. Anyone interested in understanding more about the national debt may want to read on. 

The Economics Correspondent has written repeatedly he isn’t worried about this year’s Fed Covid QE fueling price hyperinflation. To read his past entries on short and mid-term inflation click the following links:

http://www.cautiouseconomics.com/2020/04/monetary-policy-12.html

http://www.cautiouseconomics.com/2020/09/monetary-policy-17.html

However long-term inflation is more concerning although again, not because of the Fed’s massive quantitative easing of 2020. Rather, the catalyst is more likely to be the exploding national debt.

I. THE STATE OF THE NATIONAL DEBT

Because the federal government has so far borrowed nearly $3 trillion to spend on Covid bailouts, unemployment, assistance to state and local governments, and direct payments to households, the public debt has exploded to $26.8 trillion as of this writing. Meanwhile GDP contracted heavily in the spring although it should bounce back somewhat as economies reopen.

Exploding debt and a shrinking or more slowly growing economy means a skyrocketing debt-to-GDP ratio, the number that really matters to economists and policymakers.

Before the crisis the debt-to-GDP ratio had held fairly steady slightly above 100% from Barack Obama’s departure right up to March of 2020.

However with the Covid crisis the math quickly changed. Now the debt is $26.8 trillion and GDP, while erratic, is down somewhere closer to $20 trillion (it’s hard to say for certain since we’ve only gotten one full quarter’s GDP during the Covid pandemic). In the blink of an eye the debt-to-GDP ratio has risen from 107% to somewhere around 135-140%, eclipsing the all-time record of 120% set at the end of World War II.

As the debt-to-GDP ratio soared through the summer, the Correspondent worried more about inflation in the long term, but not due to some sort of “accident” resulting from a stimulus program like QE. Rather the concern was deliberate Fed policy to dilute the real value of the concerning national debt.

Some readers may already be aware of this longstanding trick by governments and central banks, but for those who aren’t just keep on reading. This might be one of the most informative and depressing things you’ll learn this month about fiscal and monetary policy.

II. IN THE AGE OF FIAT MONEY NATIONAL GOVERNMENTS NEVER HAVE TO PAY DOWN THEIR DEBTS

Governments have shown repeatedly over history that they almost never solve their debt problems through honest accounting—ie. raising taxes or preferably cutting spending. Since both of those policies are unpopular with the public and tend to get monarchs deposed or politicians thrown out of office, governments have usually resorted to inflation to lower the real value of the debt.

The trick goes all the way back to Dionysius of Syracuse (ancient Greece: 4th century BC) when he restamped all drachma coins at double their original denomination to solve his own overborrowing problems.

Or to the Roman Emperor Diocletian who helped slowly remove 98% of the silver content from the Denarius coin, using the siphoned silver to create more coins and inflate away the value of the imperial debt.

Even in the 20th century “a little more inflation” is how the U.S. government managed to whittle a debt-to-GDP ratio of 120% after World War II down to 30% by the 1970's. Washington ran deficits in 27 of the 35 years between 1945 and 1980, yet the debt-to-GDP ratio still fell by three-quarters over that time.

How? By both applying economic growth (real GDP growth) and inflating away the dollar's purchasing power from $1 to 24 cents over those 35 years, Congress never had to pay back 1945’s $250 billion nominal public debt honestly.

Back in 1945 a national debt of $250 billion was a staggering, unthinkable number. Almost no one thought such a huge sum could ever be repaid at a time when U.S. GDP was only $228 billon. But by 1980 US GDP had risen twelvefold to $2.85 trillion in nominal terms, so a $250 billion debt didn’t seem so bad by then.

But economic output had not increased twelvefold, only tripled, the result of population growth and higher productivity.

To upsize a tripling economy to twelve times its original size in nominal terms required price inflation which was devotedly provided by our central bank: the Federal Reserve. And hence what was considered an insurmountable national debt in 1945 became quite manageable by 1980.

Fast-forward to today and the debt-to-GDP ratio has grown to record heights once more in 2020. Hence the Correspondent believes the Fed will help out the very Congress that grants its monopoly power over base money by ratcheting up inflation over many years yet again—all to effectively repudiate its debt obligations through sleight of hand.

III. THE FED MAKES HIGHER INFLATION OFFICIAL

Well this is all what the Correspondent was thinking this summer. Unfortunately the Fed beat me to writing about it.

https://www.cnbc.com/2020/08/27/powell-announces-new-fed-approach-to-inflation-that-could-keep-rates-lower-for-longer.html

Late last month the Federal Reserve made a historic policy change announcing it was abandoning its long held “price stability” target of 2% annual inflation for instead an “average inflation target” of 2%.

Since official inflation has run closer to 1% for the last twelve years, the Fed argued it should run inflation higher than 2% in coming years in order to raise the “average” closer to 2%.

The new policy is inconsistent with its previous rationale for targeting 2% year-to-year, and the Fed’s policy statement included quite a bit of mental gymnastics to explain why higher inflation going forward to offset lower inflation more than a decade past is somehow a good thing.

But the real, unspoken reason is clear: The national debt is out of control—at levels that now even the Fed is worried about—and policymakers are finally acting to do something about it.

The solution will be higher inflation.

Just a little math to demonstrate the power of growth and inflation to reduce the federal government’s debt liability is illustrative:

If a $20 trillion economy grows in real terms by 2% a year, in 15 years real output will be $27 trillion (1.02^15 x $20T = $26.9T).

Then if the Fed also creates enough new money to produce 1.5% annual inflation the $27 trillion real economy grows to $34 trillion in nominal terms without a single extra widget being produced. It’s all just higher prices.

Voila, with no reduction in our government’s debt position of $26.8 trillion, the debt-to GDP ratio falls from 134% to 79% in 15 years--all through growth and inflation.

However if the Fed produces higher inflation—say, 3% a year for 15 years—the $27 trillion real economy grows to an even higher $42 trillion in nominal terms. Again, not a single extra widget is produced in the real economy, yet the debt-to-GDP ratio is more than halved from 134% to 64%—1980's levels—without the government paying down a penny of the national debt.

And history shows Congress and future presidents won’t be content to leave it at that. The Economics Correspondent predicts—in fact guarantees—they’ll take the falling debt-to-GDP ratio as license to find new ways to run even higher deficits so that 15 years from now the national debt won’t stabilize at $26.8 trillion but rather rise to $46.1 trillion or higher to reach a “sustainable” debt-to-GDP ratio of 100%.

This free lunch is made possible by the sleight of hand every government in the world uses to finance unlimited deficit spending. Keep borrowing and spending year after year, so long as growth and inflation keep bailing the Treasury out down the road.

Even President Trump was relying on it when he ran $800 billion and $900 billion deficits in the first three years of his administration. His Treasury Secretary Steve Mnuchin said repeatedly that deficits wouldn’t be much concern so long as the economy could achieve 3% annual GDP growth. A $20 trillion economy growing 3% a year in real terms and running 2% inflation can run a $1 trillion deficit with absolutely no change in the debt-to-GDP ratio. And every president before him going back to FDR played the same game.

 IV. NO FREE LUNCH, WE ALL PAY

As Milton Friedman said, there really is no such thing as a free lunch. With a hypothetical future inflation of 3% Americans and foreigners holding dollars will be the ones who pay for this seemingly magical debt payback by losing half the purchasing power of their money every 23 years, but they'll be told by the newspapers and academics that the inflation is good for them and that it “promotes full employment.”

In fact higher inflation is only a good thing for debt addicts and governments who want to spend beyond their means forever without having to pay back their accumulated debts honestly.

And as mentioned before this trick goes back to ancient Greece, but Adam Smith also condemned it famously and eloquently in his famous 1776 book “The Wealth of Nations.”

In Smith’s time most governments didn’t have the luxury of fiat money and monopoly central banks with computers that created bank reserves out of thin air. To expand the money supply and inflate prices they had to reduce the precious metal content in coins or devalue the currency unit’s definition into a lesser weight of metal.

But the fundamental principle is no different in 2020. As Smith noted nearly 250 years ago:

 "When national debts have once been accumulated to a certain degree there is scarce, I believe, a single instance of their having been fairly and completely paid..."

"…The raising of the denomination of the coin has been the most usual expedient by which a real public bankruptcy has been disguised under the appearance of a pretended payment. The honour of a state is surely very poorly provided for, when, in order to cover the disgrace of a real bankruptcy, it has recourse to a juggling trick of this kind, so easily seen through, and at the same time so extremely pernicious."

-The Wealth of Nations (Book V, Chapter III)

Tuesday, September 15, 2020

Q2 Velocity Declines A Record 26.5% and Medium-Term Prospects for Hyperinflation (Wonkish)

Click here to read the original Cautious Optimism Facebook post with comments

4 MIN READ - The Cautious Optimism Correspondent for Economic Affairs and Other Egghead Stuff pondered prospects for hyperinflation during the Federal Reserve’s gargantuan spring quantitative easing. Now he follows up with prospects for inflation in the medium term.

Last April the Economics Correspondent wrote a series of articles predicting no hyperinflation despite the Fed’s unprecedented, bigger-than-2008 quantitative easing. Not only did the Fed drive the monetary base straight up this spring, but unlike 2008 its policy also resulted in a huge increase in the broader money supply (measured by aggregates M1 and M2).

Nevertheless, the Correspondent predicted plummeting monetary velocity would offset money creation resulting in very little inflation and certainly not hyperinflation.

From his April 26, 2020 post:

“During the financial crisis single-year period 2Q2008 to 2Q2009 monetary velocity fell by 17%... …the Economics Correspondent believes the Fed anticipates an even larger drop in velocity than 17% for 2020 and that the decline will easily outpace GDP’s”

Well the Q2 velocity numbers are out and they’re impressive. M1 velocity plummeted by 26.5% in a single quarter. 

Not 17% in a year. 26.5% in a quarter.


https://fred.stlouisfed.org/graph/fredgraph.png?g=vzeK

Federal Reserve official velocity records only go back to 1959, and no quarterly decline in monetary velocity for the last 60 years has even come close.

https://fred.stlouisfed.org/series/M1V

NBER velocity estimates that go back to 1869 show the same: The second quarter's collapse has set a record that goes back at least 140 years, and probably for all of American history.

https://fred.stlouisfed.org/series/A14187USA163NNBR

And that’s why the record amounts of money created in Q2 produced not only no hyperinflation, but even a slight deflation for the quarter (CPI changes in April, May, and June were -0.8%, -0.1%, and +0.6%).

Incidentally it’s worth noting that by making this one correct prediction the Economics Correspondent now has more to his name than New York Times columnist Paul Krugman.

So now that the large spring economic contraction is behind us, what are the prospects for hyperinflation going forward?

Eventually the Correspondent’s crystal ball will cloud up and his luck will run out, but he can confidently say even in the absolute worst case there is still virtually no threat of hyperinflation. Slightly higher inflation perhaps, but not hyperinflation.

Let’s explain why.

Since the Fed launched its unprecedented easing campaigns in mid-March the money supply as measured by M1 and M2 has risen 31% and 17% respectively with those increases leveling off the last few months.

https://fred.stlouisfed.org/graph/?g=vJyb


https://fred.stlouisfed.org/graph/?g=vJyf

And as previously stated, falling velocity offset all of that new money.

However velocity’s rapid decline will certainly level off too if for no other reason than 26.5% quarterly declines are simply unsustainable. Another plausible reason is that the economy has been reopened, millions of workers have been rehired, and consumers and businesses are spending more money than during the spring lockdown. Under those conditions velocity simply can’t fall 26.5% again.

So will a recovery in velocity be the catalyst to finally fuel hyperinflation? Once again, probably not.

Let’s take the absolute worst and highly unlikely case. What if velocity were to instantly jump back to its pre-pandemic levels right now?

Well, if we ignore GDP for the moment M1 and M2 being 31% and 17% higher would translate into a price level 17%-31% higher than in March.

Now that would be a major inflationary event and quite harmful, but it still wouldn’t be hyperinflation. And absent another giant Fed QE it would also be a “one-and-done” event.

By comparison let’s look at real hyperinflation. When people mention Venezuela and Zimbabwe hyperinflation—which many did when the Fed began its massive QE in March—they’re referring to 1 million and 11 million percent price increases—year after year after year—not a onetime hike of 17% or 31%.

So yes, if—and it’s a gigantic if—velocity returned to normal overnight the USA would experience a single major, harmful inflationary event, but it still wouldn’t be hyperinflation.

Now let's include GDP in the mix.

If velocity really did return to February 2020 levels so quickly, it wouldn’t happen in a vacuum. Such a massive spike in velocity would be accompanied by a consummate rebound in real GDP. Since according to the Equation of Exchange (mv = py) rising output reduces prices, a huge velocity rebound would be at least partially offset by increased economic activity. 

So instead of 17% or 31%, inflation would be more subdued—maybe mid or high single digits, and again just a onetime event.

And all of these scenarios assume the Fed would not react by adjusting the remaining component of the Equation of Exchange it has a greater degree of control over: the money supply.

This is where things get a bit tricky, because if velocity really did take off and rising output was not enough to offset it, the Fed would be forced to pull back some of the new money it has created. 

To do so it could sell off securities in open market operations to withdraw reserves from the banking system, or raise the IOER (Interest on Excess Reserves) rate it pays banks on the trillions of dollars in excess reserves they hold at the Fed instead of lending them out. It could also raise the traditional Fed Funds policy rate.

So a theoretical 20% increase in velocity offset by a 10% recovery in output could be addressed with a 5% decline in the money supply resulting in only a 2.6% increase in prices ($1.00 x 1.2 x 0.9 x 0.95 = $1.026).

What's the tricky part? As George Mason economist Lawrence White has stated, the Fed would have to “thread a small needle” to pull off such a feat without causing another recession.

But there’s a good chance (not 100%, but good nevertheless) that the Fed won’t even have to resort to pulling back on the money supply, as velocity will rise at a slower pace than “back to normal overnight” and to the extent it accelerates it will be accompanied by an increase in economic output which acts to restrain prices.

OK, so what about the long term, into 2021 or even several years out? The Correspondent will address the more distant horizon in the next article.

To read the Correspondent’s April 26 post predicting no hyperinflation, go to:

http://www.cautiouseconomics.com/2020/04/monetary-policy-12.html

Friday, September 4, 2020

August Unemployment Down 6.3 Points in Four Months: Comparing the 2020 Jobs Recovery to the 2008 Recession

Click here to read the original Cautious Optimism Facebook post with comments

Unemployment rate: 2008-2020

4 MIN READ - The Cautious Optimism Correspondent for Economic Affairs and Other Egghead Stuff analyzes the stark contrast between the 2020 jobs recovery and that of the Obama years… even if the media won’t.

Today the Bureau of Labor Services announced that 1.4 million jobs were created in August.

But more importantly, the August unemployment rate fell to 8.4%, far below the consensus forecast of 9.8%.

Four months ago, the unemployment rate peaked at 14.7%, accompanied by endless media headlines comparing the Coronavirus recession to the Great Depression.

The Economics Correspondent, himself author of twenty CO articles on the Great Depression, thought from the beginning that such comparisons were uninformed and ridiculous.

During the Great Depression, unemployment not only peaked at 25.9% (1933) but it remained over 10% for more than a decade (October 1930 - February 1941 to be exact).

In 2020 unemployment hovered in the double-digits just four months before making its exit.

That’s 124 months versus four. “Not comparable” would be an understatement.

But what’s even more striking about the August unemployment rate is that it’s already down 6.3 percentage points from the peak in just four months.

Let’s contrast this to the jobless picture after the 2008 financial crisis.

Under Barack Obama the unemployment rate peaked in October of 2009 at 10.2% and reached full employment, loosely defined as 5% joblessness, in September of 2015 nearly six years later.

Even as Obama was on his way out in January of 2017 unemployment was at 4.8% or down 5.4 percentage points, and it took a Trump administration to get the rate down to 3.8% (finally down 6.3 points) in May of 2018 or 8 years and 8 months later.

See chart for a dramatic visual representation:

https://fred.stlouisfed.org/graph/fredgraph.png?g=vefK

Granted, once you’re down to full employment it’s more difficult to reduce the jobless rate as quickly, but the comparison is still worth repeating: In 2020 it’s taken four months for unemployment to fall 6.3 points from the peak. In 2009 it took 104 months. So the job recovery in the Trump era is so far moving 26 times faster than that of the Obama era.

The press was rapid-fire, trigger-happy quick to compare joblessness under Trump to the Great Depression just a few months ago, but today it’s dead silent when it comes to comparing job recoveries under Trump and Obama... or the Great Depression, or any other recovery for that matter.

So why was unemployment so much slower to fall during the Obama years? The Economics Correspondent sees two primary reasons: one beyond Obama’s control, and the other quite Obama-specific.

First, what Obama had little control over was the nature of the recession he was handed. After the 2008 financial crisis the economy was highly imbalanced and had to undergo fundamental readjustments. There was a huge bad mortgage overhang, many banks were reeling from massive deterioration in their assets and loan portfolios, and an oversized portion of the economy that had been misallocated to real estate and finance had to be diverted away to more rational lines of business.

Those kinds of adjustments take time. Not necessarily six years but they don’t fix themselves overnight either.

By contrast the economy was doing extremely well in early 2020 when it was suddenly hit by an exogenous shock. The introduction and spread of Covid-19 into the USA disrupted the behavior of consumers and businesses—even on a voluntary basis. People stopped flying and avoided restaurants, bars, movie theaters, concerts, cruise ships, public transportation, and countless other venues. Spectator sports closed their doors to fans. Many businesses told workers not to come to the office and laid off those who couldn’t work remotely.

This isolation problem was further compounded by government lockdowns that prohibited even those consumers, businesses, and workers who wanted to participate in the economy from doing so.

But there was no major fundamental problem with the economy itself.

As soon as lockdowns were loosened across the country, economic activity partially resumed and moved closer to its pre-pandemic levels. Thus unemployment has fallen rapidly from the April peak. However it will likely take a full resolution of the virus problem before full employment is possible again, and monthly job gains will probably slow from the torrent pace of the summer.

One could argue the economy was already in great shape because of Trumponomics policies and there would be some truth to that. But even a President Hillary Clinton would likely be looking at a healthier economy in early 2020 than Barack Obama was faced with in early 2009.

Second, the policy responses by the Trump and Obama administrations couldn’t be more different.

President Obama took a fragile economy barely starting to recover and hindered it further with thousands of new regulations, raised taxes (in 2012), and launched a nonstop rhetorical war on the employers who he also expected to reduce unemployment. 

Obamacare itself was a huge job killer, as businesses 50 fulltime employees or over were required to provide health insurance and thus small businesses refused to grow to over 50 workers or even laid off enough to get below 50. And large corporations cut hours to convert millions of workers from full to part time.

It’s no coincidence that the job recovery to full employment—when measured from the date of a banking crisis to when 5% unemployment was reached—was the second longest in American history at exactly seven years, only after the Great Depression itself.

Now *there* was a valid Great Depression comparison, but the press was silent on that one too.

President Trump’s response to his recession has been fairly hands off and if anything gone in the opposite direction. There have been tax refunds instead of tax hikes, and he has signed emergency deregulation instead of adding regulations, although most of the rules suspensions have been designed to speed up and facilitate fighting the virus.

Both Presidents signed stimulus legislation. While the Economics Correspondent is not generally a fan of stimulus spending, there have been key differences there as well.

The Obama stimulus focused heavily on channeling government deficit spending towards green energy companies—nearly all of which failed—and overpriced/wasteful public works programs, many of them politically motivated. 

The Trump stimulus has been focused more on government deficit financing of "bridge support" to a post-Covid recovery for existing businesses and industries, not ones he’d like to create himself.

Both stimulus plans expanded unemployment benefits. While the Correspondent doesn’t think it was a good idea to offer low-skilled workers additional payments that were more lucrative than working, the Obama stimulus extended unemployment checks for up to 99 weeks which incentivized millions to put off looking for work longer. And of course the current recession only began about 20 weeks ago so there hasn’t even been a reason to offer 99 weeks of benefits.

So the current job recovery is to date the fastest in American history, the press has suddenly gone silent with amnesia, and the contrast between 2020’s job market and that of 2009-2018 couldn’t be greater. The fast-track to reemployment under Trump is due in part to the unique and shorter-term nature of the recession, but it’s also an indictment of the job-killing policies of the Obama administration and the generally job-friendly policies under Donald Trump.

And don’t expect to hear that from the press, especially two months before the election.

Tuesday, September 1, 2020

Inflation and Deflation Fallacies Part 2: "Deflation Plunges Economies Into Depression"

Click here to read the original Cautious Optimism Facebook post with comments

Apoplithorismosphobia: (n.) The fear of monetary and economic deflation.

5 MIN READ - The Cautious Optimism Correspondent for Economic Affairs and Other Egghead Stuff continues with the his series on inflation and deflation fallacies

The view that falling prices invariably produce rapid and painful recessions and depressions is accepted almost as religious dogma among central bankers, government policymakers, the press, and many academics. 

The hypothesis, which has clearly not been closely examined historically or theoretically, is that if consumers and businesses see prices falling they will put off purchases and the loss of demand will plunge the economy into a “deflationary spiral” from which it will need decades to recover.

And according to many deflationphobists, prices don’t even have to fall. In the minds and writings of mainstream economists like Paul Krugman, Ben Bernanke, and Larry Summers no inflation or even too little inflation—say, prices rising only 0.5% or 1% per year—is enough to produce a recession or stymie a recovery

II. THEORETICAL PROBLEMS: TIME PREFERENCES

To quote British Keynesian economist Duncan Wheldon:

"Falling prices might sound like a good thing, and in individual cases they often are, but a falling general price level is usually associated with severe economic strains. Why buy anything today if it will be cheaper next week? The end result tends to be falling output, rising unemployment, falling wages and a large increase in the real burden of debt."

What could be wrong with that reasoning? Surely if prices fall, or even stay flat, no one will buy anything and we will experience another Great Depression, right?

Actually there are plenty of glitches in this reasoning. 

First, consumer and business time preferences have to be factored in. All things being equal, consumers and especially businesses tend to prefer consumption in the present over consumption in the future. 

In fact at the extreme no one really stops buying completely. Imagine if everyone stopped buying food because they felt food prices will be cheaper in a year. All of humanity would starve to death. 

The same is true for not paying rent or the mortgage or the power and gas bill. In most places we’d die from exposure to the elements. Clothes, medicine, and many other consumables are absolute necessities and no one is going to stop buying them just because they might be 1% cheaper in a year.

But what about discretionary goods? Surely if discretionary consumables fall in price then purchases will grind to a halt, right?

No. Consumer time preferences play a strong role even with nonessential purchases. 

Let’s take Starbucks coffee with 0.5% annual deflation for example. To paraphrase Austrian economic historian Thomas Woods, does anyone really believe Starbucks customers are thinking “I’m not going to have that cup of coffee this morning, because next year it will be two cents cheaper?” 

A year later are consumers thinking “Those Starbucks people must think I’m some kind of a sucker, it’s going to be another two cents cheaper next year?”

Of course not. Starbucks customers, even armed with an expectation that prices may fall 0.5% a year, are still going to buy their coffee today—because of time preferences.

But Starbucks coffee is a relatively cheap item. The savings are much larger on big ticket items so consumers will certainly hold off on those purchases, right?

Well let’s look at one of the biggest ticket consumer goods there is: cars. 

With 0.5% deflation a consumer who really wants a new car for $25,000 might be able to get it for $125 less if they wait a year ($24,875).

If they put 5% down and take out a car loan, as most consumers do, for 60 months at 4% interest their monthly payment will fall from $437.39 to $435.21: a savings of $2.18. How many people would really postpone buying a car they want or need for one year because they anticipate they might save $2.18 a month?

According to Woods, in the deflationphobists' view of the world “None of us are going to buy anything until we’re on our deathbed and then we’ll finally reach out and grab an iPhone just as we’re expiring.”

The same time preference paradigm is even truer for businesses. 

Companies that need to make their capital purchases and investments now in order to secure greater revenues and a return on investment tomorrow aren’t going to defer their plans by a year hoping to save 0.5%. In the year they wait their operations will be so disrupted (not to mention the loss of their higher revenue streams) that the costs would be far greater.

OK, well what if prices fall faster, like 1% or even 2%? 

Well no need for theory. Let’s just look at actual evidence in possibly the most deflationary sector of the economy: consumer electronics. Everyone knows if they buy a phone or a TV or a computer today, a better version will come out in six months for less money, often at a discount greater than 1% or 2%. It’s been that way for decades.

Are the phone, TV, or computer industries in Great Depression as a result? Has there been a 30 or 40 or 50 year slump in consumer electronics because no one is buying? Of course not. It’s been possibly the hottest growth industry all that time. Because there are some things that human beings just want now and they’re not going to put their entire lives on hold for a year or two just to save 0.5%... or 1%... or 2%.

III: THEORETICAL PROBLEMS: CONSUMPTION VS SAVING

And to the extent that consumers might really curb their purchases slightly the necessary result would be greater savings (ie. deferral of consumption), an indispensable key to economic growth. 

Real savings were a critical component fueling the explosive growth of the American economy in the late 19th century, or Great Britain during the Industrial Revolution, or Japan after World War II, or China in the last 30 years, as opposed to the sluggish growth plaguing most of the overconsumption world in the 2000’s. 

Because the actual physical tools and machines that make workers more productive and new technologies available don’t exist if consumers spend all their income on immediate gratification now instead of preserving some share of the productive economy to produce the advanced tools and machines that will fuel a larger, more prosperous economy tomorrow.

Deflationphobic economists assume that spending and consumption are the key to economic growth, neglecting the critical precondition of saving. Someone must forgo consumption in the present, but many mainstream economists—particularly Keynesians—believe central banks printing more money and transferring it to banks in exchange for bonds (their idea of saving) is a credible substitute for tangible capital resources. It’s not.

(Note: this is the larger concept of capital theory which the Correspondent will write about in greater detail later).

IV. HISTORICAL EVIDENCE

OK so the theory all sounds good, but surely empirical evidence supports the deflationphobia view, doesn’t it?

Well it just so happens we have historical evidence in the United States and plenty of it: over 100 years in fact.

From 1800 to the establishment of the Federal Reserve in 1914, prices nationwide fell about 42%. That’s slightly faster than a compounded average of 0.5% deflation per year. 

Granted there were some ups and downs in that century-plus, namely inflations during wars such as the War of 1812 and the Civil War, and an experiment with artificial bimetallic inflation in the early 1890’s, accompanied by slightly more rapid deflations between inflationary periods.

But for the vast majority of those 114 years prices fell in the United States.

Was the result a 114 year Great Depression that dwarfed the 1929-1946 Great Depression? No, the United States grew into the world’s largest economy in what’s considered an economic miracle of that period by all but the most hardcore Marxist economists and economic historians. 

This presents quite a quandry for the deflationphobists who warn 0.5% deflation or even zero inflation will lead to disaster.

The same story holds true in Great Britain, Canada, Germany and the industrialized European nations of the 19th century. Prices gently fell and far from tanking, their economies boomed. So both the empirical evidence, as well as the more closely examined theory, contradict the mainstream view that insufficient inflation or even benign deflation will plunge economies into deep depression.

We’ll examine the economics profession’s deflation blind spot in more detail in Part 3.