Thursday, November 16, 2017

Lessons from the Great Depression: Taxes

Click here to read the original Cautious Optimism Facebook post with comments

6 MIN READ - An important dispatch from the Cautious Optimism Correspondent for Economic Affairs and other Egghead Stuff
CO has been watching with great interest the Republican Congressional and Trump White House tax proposals. Predictably, critics have again complained that cutting taxes for the largest taxpayers—the wealthy and corporations—is not only unfair to the bottom 80% of Americans who pay just 5% of income taxes (source: OMB via Washington Examiner), but that it will bring harm to what was until recently a very slowly recovering economy.

Meanwhile the financial crisis and worst of the Great Recession are fading in the rear-view mirror, even as tax policy was also a heated topic of discussion then, and pundits, politicians, and academics persistently invoked the Great Depression as their guide—arguing the critical importance of understanding the fiscal mistakes of the 1930’s if we were to avoid another Great Depression or Japan-style malaise. Well it’s true a great deal can be learned from the tax failures of the 1930’s, so what exactly are those lessons?

The prevailing story for decades has been that in the wake of the October 1929 stock market crash, Herbert Hoover stubbornly clung to a dogmatic policy of laissez-faire, refusing to intervene and even slashing the federal budget at a time when the country needed (according to Keynesian economists) expansionary stimulus. As early 1930’s budget cuts dominated the post-2008 conversation and taxes weren’t discussed as much, the constant barrage of stories about Hoover’s alleged refusal to involve the federal government strongly suggested he was motionless on taxes as well or even cut them. The conclusion, we are told to accept, is Hoover’s refusal to recruit the powers of the federal government tragically and avoidably transformed the Recession of 1929 into the Great Depression. That’s the New York Times/CNN/education system version.

But even a passive glace at 1929-1933 tax policy reveals that narrative is a baseless myth. What really happened was quite different:

In 1932, with the economy reeling and a combination of falling tax receipts and profligate spending (more on spending in another CO installment on the Great Depression) Herbert Hoover was confronted with the problem of growing deficits. For every dollar of federal revenue, Washington was spending $2.47 and deficits were reaching 4.5% of GDP. By comparison, during the worst budgets of the George W Bush administration, the annual deficit peaked at 3.5% of GDP. And during the 1930’s a deficit of either magnitude was considered inconceivable and alarming.

Hoover felt strongly the deficit had to be closed. But instead of urging Congress to pull back on spending (as we’re told to believe by most newspapers and economists) he attempted to bridge the gap by signing the Revenue Act of 1932—the greatest peacetime percentage tax hike in American history, then or ever since.

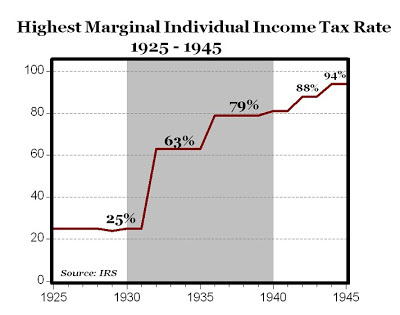
For starters, Hoover targeted the rich. The top marginal income tax rate was raised from 25% to 63%. Yes, you read that correctly: the top rate surged from 25% to 63% or a tax liability increase of 150% in the middle of a depression (see link or pretty much any online historical table of marginal tax rates).

http://www.taxpolicycenter.org/statistics/historical-highest-marginal-income-tax-rates

The working and middle classes weren’t spared either. Although their 1930’s tax brackets were very low by today’s standards (1.5% to 5%) the Hoover hike to a range of 4% to 8% inflated Americans’ tax bill by  60%-166% depending on which bracket they had previously populated.

Furthermore, as Murray Rothbard recounts in his classic book “America’s Great Depression”:
“The corporate income tax was increased from 12 percent to 13 percent, and an exemption for small corporations eliminated; the estate tax was doubled, and the exemption floor halved; and the gift tax, which had been eliminated, was restored, and graduated up to 33 percent.”
…and furthermore…
“Many wartime excise taxes were revived, sales taxes were imposed on gasoline, tires, autos, electric energy, malt, toiletries, furs, jewelry, and other articles; admission and stock transfer taxes were increased; new taxes were levied on bank checks, bond transfers, telephone, telegraph, and radio messages… … The raising of postal rates burdened the public further and helped swell the revenues of a compulsory governmental monopoly. The letter rates were raised from 2¢ to 3¢ despite the fact that the Post Office’s own accounting system already showed a large profit on first class mail. Postage on publishers’ second class mail was raised by about one-third, and parcel post rates on small parcels were increased by 25 percent.”
It's no wonder then that the year following the Revenue Act of 1932 was the worst in American economic history—then or ever since as well. The bottom figuratively fell out from under the country, with real GDP plummeting to 1922 levels and the unemployment rate rising nearly eight points in a single year, from 18% to nearly 26%. By comparison in the twelve months following the October 2008 financial crisis unemployment rose by 3.5 points to its peak of 10.0% in October 2009 (source: Bureau of Labor Statistics).

So while Hoover has been roundly criticized by mainstream economists and the media for years for closing the deficit at a time when (according to them) deficits were a necessary stimulus, they almost never criticize him for the record tax hike. In fact, not only are they not critical of the tax hike, they’re virtually silent on it which should make us all a bit suspicious about the motives behind such a glaring omission. After all, a 60%-160% tax hike on all of America during a deep recession isn’t some insignificant fiscal move unworthy of discussion. Do they really want us to learn the lessons of the Great Depression or just the ones they like?

Now to the extent that today’s left-leaning economists are ever forced to acknowledge Hoover’s tax hikes (which is rare), a common fallback to the next line of defense goes something like this: “Well a lot of other things were happening after the 1932 Revenue Act that caused the fallout in 1933. There was a major banking crisis early that year for example.”

And that’s true. However even if you suspend disbelief momentarily and accept that the huge tax hikes of 1932 contributed very little to the 1933 plunge, all one has to do is fast forward to 1936 for more evidence. Franklin Roosevelt enacted another large tax increase that year with the Revenue Act of 1936. The “Soak the Rich” tax was introduced, raising the top tax rate to 79%. Capital gains taxes were hiked from 17.7% to 22.5%. Corporate taxes were raised from 13.75% to 15%. And a new “Undistributed Profits Tax” of up to 27% was levied on corporations.

So it’s not surprise that the following year America fell into depression again, the Depression of 1937-38 (also referred to as “America’s only depression within a depression”) which was the third worst dip of the 20th century. Unemployment, which had been slowly recovering due to the stabilizing banking system, about-faced and rose six points in a single year (14% to 20%).

So it seems unlike progressive claims that massive tax hikes, especially on the wealthy, ushers in rapid recovery and quick prosperity, history and reality show instead that it creates worsening and prolonged depression.

And despite the ongoing myth that Herbert Hoover’s stubborn adherence to laissez-faire policy and tax cuts caused the Great Depression, the truth is the opposite. Hoover launched record tax hikes, and as we will cover in the next installment on the Great Depression, was also a profligate spender. In other words: he ballooned the size of government both in the tax and spending columns, not to mention also with wage, trade, and regulatory policy. Not only are the myths myths, they frame a diametric opposite portrait of what really happened.

So when the next recession comes to America—or even while politicians, academics, and journalists argue the merits of the current Trump tax package—remember the real lessons of the Great Depression. Double-digit tax hikes on the rich and higher federal spending, aka. bigger government, while a drag in a growing economy, leads to extended and more painful slumps when applied during recessions or fragile recoveries. We know because it happened in the real world—outside the halls of academia and CNN’s editing room.

Note: For those interested in demolishing more longstanding myths about Herbert Hoover’s lack of depression-fighting policies, CO’s Economic Affairs Correspondent highly recommends reading Part III of Austrian economist Murray Rothbard’s masterful “America’s Great Depression,” available free in PDF format.

https://mises.org/library/americas-great-depression

Monday, October 30, 2017

Is Connecticut’s Slanted Tax Structure Inviting Crony Capitalism?

Click here to read the original Cautious Optimism Facebook post with comments

From the ornate mahogany desk of the Cautious Optimism Correspondent for Economic Affairs and other Egghead stuff.


As CO has recently reported, Connecticut is losing population due to the burden of heavy taxation and over-regulation.

Adding fuel to the fire is Connecticut’s heavily progressive and relatively new tax structure. After having no income tax until 1991, Connecticut’s current lowest income bracket has since reached 3% while the tax rate on single earners making over $500,000 has quickly risen to effectively 7% (6.99%). 

Taxes on estates of over $10 million is 12% (on top of the federal estate tax rate of 40% for an effective rate of 52%). In addition to property taxes, the corporate state tax rate is among the nation’s highest at 9% (source: Bankrate.com).

All this adds up to a huge share of Connecticut’s tax revenue stemming from a small number of wealthy taxpayers, many of whom own businesses in Connecticut and several of whom have made high profile departures in the last few years. For example, (from the Yankee Institute):

"Connecticut faces an outmigration trend in which higher-earning individuals are leaving the state, with Florida being one of the primary beneficiaries."

"Florida, with no income tax, has been attracting wealthier individuals as Connecticut passed two of its largest tax increases in history in 2011 and 2015. Notably, Florida has siphoned off some of Connecticut’s wealthiest people. In 2015, hedge fund manager Paul Tudor Jones moved from Greenwich to Florida, taking with him nearly $30 million in income tax revenue."


And the two historic tax hikes in 2011 and 2015, combined with the wealth exodus, has put further pressure on the remaining rich. The result has been greater and greater budget dependency on a shrinking and evermore exclusive club of well-to-do citizens. Also from the Yankee Institute:

"A 2014 study by the Connecticut Department of Revenue Services found that 357 families account for 11.7 percent of the total Connecticut income tax burden. Those 357 families paid $682.5 million in income tax in 2014, so minor fluctuations in the number of high wealth families and their income levels can have big consequences for balancing the budget."

Connecticut’s dependence on this dwindling pool of wealthy taxpayers has propelled officials to keep a very close eye on them, even meeting with one personally to discuss what accommodations might convince him not to leave. As the Hartford Courant reports:

“Two years ago, tax officials were alarmed that a super-rich hedge fund owner might leave and reduce the state's income tax revenue. They met with the unidentified taxpayer. The effort was partly successful, with the taxpayer's leaving Connecticut but agreeing to keep the hedge fund here.”

Which raises an interesting question: If government tax policy makes it so dependent on a handful of taxpayers to fund its operations that officials meet personally with them to keep them in Connecticut, is the same tax policy making the same officials vulnerable to political influence?

Or put another way, despite all the grumbling by progressive leftists about the rich “buying” government, does their vaunted progressive taxation actually enable more “government buying” and crony capitalism? Is corruption built into state-level “soak the rich” policies?

When officials rely so heavily on a handful of residents to pull the entire budget wagon, it empowers that exclusive club to exert enormous influence over them. Politicians can more easily be talked into compensatory forms of accommodative policy to keep their sponsors happy. 

Perhaps progressive taxation through democratic government produces more undemocratic results than voters and politicians would like to believe—another example of government policy producing the opposite results it was intended to.

Source stories:


Monday, October 23, 2017

Some Famous Macroeconomic Predictions from 1929-2009

Click here to read the original Cautious Optimism Facebook post with comments

4 MIN READ - From the desk of the Cautious Optimism Correspondent for Economic Affairs and other Egghead Stuff 


2005-2009: More recent macroeconomic predictions

As we approach the 88th anniversary of 1929’s Black Thursday stock market crash, here are some predictions by several famous economists and policymakers.


"We will not have any more crashes in our time"

-John Maynard Keynes (Keynesian School), 1927


"There will be no serious consequences in London resulting from the Wall Street slump. We find the look ahead decidedly encouraging.”

-John Maynard Keynes (Keynesian), November 1929


"Stock prices have reached what looks like a permanently high plateau"

-Irving Fisher (Quantity Theory School), October 17, 1929


“The end of the decline of the Stock Market will probably not be long, only a few more days at most”

-Irving Fisher (Quantity Theory), November 14, 1929


"[The economy is] in its 150th month of unparalleled, unprecedented, and uninterrupted economic expansion" and has taken a 'dramatic departure' from the past."

-Arthur Okun (Keynesian), LBJ Council of Economic Advisors, from “The Obsolescence of the Business Cycle" in his book "The Political Economy of Prosperity," 1970. Over a decade of stagflation would follow


“Meanwhile, economic policy should encourage other spending to offset the temporary slump in business investment. Low interest rates, which promote spending on housing and other durable goods, are the main answer.”

-Paul Krugman (Keynesian), Nobel Laureate, October 2001


“The good news about the U.S. economy is that it fell into recession, but it didn’t fall off a cliff. Most of the credit probably goes to the dogged optimism of American consumers, but the Fed’s dramatic interest rate cuts helped keep housing strong even as business investment plunged.”

-Paul Krugman (Keynesian), Nobel Laureate, December 2001


"On the basis of historical experience, the risk to the government from a potential default on GSE debt is effectively zero."

-Joseph Stiglitz (Keynesian), Nobel Laureate, 2002


"The stability of our economy is greater than it has ever been in our history. We really are in remarkable shape... The United States is at the peak of its performance in its history... I think monetary policy is primarily responsible for it."

-Milton Friedman (Monetarist School), December 2005


“The United States economy has never been in better shape… … monetary policy is spectacular.”

-Arthur Laffer, August, 2006


“To be honest, a new bubble now would help us out a lot even if we paid for it later. This is a really good time for a bubble… There was a headline in a satirical newspaper in the US last summer that said: 'The nation demands a new bubble to invest in,' and that’s pretty much right.”

-Paul Krugman (Keynesian), Nobel Laureate, May, 2009


“A great crash is coming, and I don't want my name in any way connected with it."

-Ludwig von Mises (Austrian School), summer 1929, to his wife when asked why he turned down a lucrative job at Austria’s largest bank, the Kreditenstalt, which failed spectacularly in 1931.


“Ironically, by transferring the risk of a widespread mortgage default, the government increases the likelihood of a painful crash in the housing market. This is because the special privileges of Fannie, Freddie, and HLBB have distorted the housing market by allowing them to attract capital they could not attract under pure market conditions. As a result, capital is diverted from its most productive use into housing. This reduces the efficacy of the entire market and thus reduces the standard of living of all Americans...

...However, despite the long-term damage to the economy inflicted by the government’s interference in the housing market, the government’s policies of diverting capital to other uses creates a short-term boom in housing. Like all artificially-created bubbles, the boom in housing prices cannot last forever. When housing prices fall, homeowners will experience difficulty as their equity is wiped out. Furthermore, the holders of the mortgage debt will also have a loss. These losses will be greater than they would have otherwise been had government policy not actively encouraged over-investment in housing...”

...Perhaps the Federal Reserve can stave off the day of reckoning by purchasing GSE debt and pumping liquidity into the housing market, but this cannot hold off the inevitable drop in the housing market forever.”

–Ron Paul (Austrian School), Congressional Testimony 2002


…and a few bonus quotations!


“The Soviet economy is proof that, contrary to what many skeptics had earlier believed, a socialist command economy can function and even thrive.”

-Paul Samuelson (Keynesian and Nobel Laureate), in the 1989 version of his textbook “Economics.” The Soviet Union collapsed that same year.


“[i]t is a vulgar mistake to think that most people in Eastern Europe are miserable.”

-Paul Samuelson, in the 1976 version of his textbook “Economics”


“Can economic command significantly accelerate the growth process? The remarkable performance of the Soviet Union suggests it can. Today it is a country whose economic achievements bear comparison with those of the United States.”

-
Lester Thurow, MIT economist, and Business School Dean, in 1989. Also co-founder of the progressive Economic Policy Institute. Again, the Soviet Union collapsed two years later.


“What counts is results, and there can be no doubt that the Soviet planning system has been a powerful engine for economic growth. . . . The Soviet model has surely demonstrated that a command economy is capable of mobilizing resources for rapid growth.”

-
Paul Samuelson (Keynesian), 1985


“I fear that those who think the Soviet Union is on the verge of economic and social collapse are kidding themselves.”

-
Arthur Schlesinger, famous liberal historian, “court historian” to John F Kennedy White House, social critic, and public intellectual, in 1982.


“A Messiah rather than a dictator.”

-
Joan Robinson (Keynesian), about North Korean leader Kim Il-Sung from her report “Korean Miracle.”


“[o]bviously, sooner or later the country [Korea] must be reunited by absorbing the South into socialism."

-
Joan Robinson (Keynesian)


"As the North [Korea] continues to develop and the South to degenerate, sooner or later the curtain of lies must begin to tear.”

-
Joan Robinson (Keynesian)


“moderate and humane"

-
Joan Robinson (Keynesian), regarding Chairman Mao Zedong’s intentions in her 1969 book “The Cultural Revolution in China.” Robinson was both an admirer of Mao and of his Cultural Revolution.

Thursday, October 5, 2017

Trump Suggests Clearing Puerto Rico’s Debt, But Will Puerto Rico Rein In Its European Levels of Spending?

Click here to read the original Cautious Optimism Facebook post with comments

3 MIN READ - Thoughts on Puerto Rico from The Cautious Optimism Correspondent for Economic Affairs and other Egghead Stuff.


As CO has recently reported on Puerto Rico’s post-Hurricane Maria debt position, it’s helpful to look at some numbers that explain why the Commonwealth’s fiscal situation got so desperate in the first place.

When Puerto Rico’s debt crisis made headlines in 2014 and into 2015 most major US newspapers were full of columns blaming low taxes and tax cuts for the Commonwealth’s accumulated budget shortfalls. Meanwhile more conservative/free market outlets blamed out-of-control government spending.

So which narrative was right?

Well it happens that very same year the New York Federal Reserve published its own report on Puerto Rico’s economic competitiveness...

https://www.newyorkfed.org/medialibrary/media/outreach-and-education/puerto-rico/2014/Puerto-Rico-Report-2014.pdf

The comprehensive paper analyzed many economic indicators such as GDP, unemployment, private debt, labor markets, regulations, etc… but also included the all-important metrics on tax/fee revenue and government spending.

Despite progressive claims that Puerto Rico’s debt crisis was the product of tax cuts, Puerto Rico ranked #1 for government revenues as a percent of GDP (38.65%) among all 50 states plus District of Columbia plus itself (see page 14, figure 10). 

However, unlike the continental United States, Alaska, and Hawaii the Commonwealth government owns and operates sizable state-owned enterprises (SOE’s) delivering services such as electric power, health insurance, and transportation to the island. And a significant share of its revenue comes from SOE’s.

Yet even after removing SOE revenues, Puerto Rico tax revenues still ranked #2 out of 52 states/districts at 14% of GDP. As the New York Fed report states:


“Puerto Rico’s overall state and local tax burden, at 14 percent of GDP, is heavy compared with that of most mainland states. Among the fifty states plus the District of Columbia, Puerto Rico would rank second in terms of total tax burden.”

Furthermore Puerto Rico residents enjoy the advantage of paying no federal income tax to Washington, DC (except for federal employees) and the island receives Medicare and Social Security payments as well as continuous federal aid. So with the second highest tax revenues in the United States plus sizable intergovernmental transfers it’s hard to see insufficient revenues or tax cuts as a problem.

But what about spending? The New York Fed report did not tally spending minus SOE’s, but when including all government spending Puerto Rico not only exceeded every other state at a mindboggling 50.1% of GDP, its total expenditure ranked it sixth highest out of 31 OECD countries (see page 17, figure 12). 

Let me repeat that. Puerto Rico’s government spends more as a percent of GDP than the overwhelming majority of OECD countries. 

That means more spending than not only the United States itself, but also most European social democracies including Spain, Portugal, the Netherlands, Norway, the UK, Germany, and more—many of which also have their own SOE’s, an amazing display of government inefficiency and largesse. Although in fairness they were still beat out by Greece, a country that was allegedly suffering from “austerity” and draconian spending cuts during the same period (restrain laughter).

Now one important factor to consider is that Puerto Rico is responsible for funding a greater share of its  own highway construction than most states—although it still receives some financial assistance from the federal government—which would necessitate marginally higher spending levels than most states. 

However the island also enjoys the benefit of military protection from the United States while paying no income taxes to Washington, much like the European countries it emulates. Given that total public construction spending (above and beyond just roads and highways) in the United States is less than half that of defense spending (source: St. Louis Federal Reserve), the Commonwealth enjoys a considerable net benefit from the pay-for-highways/free-defense tradeoff. And sharing some of the road transportation costs with Washington is not going to account for the difference between, say… Texas and Norway levels of spending.

Given that Puerto Rico has been devastated by Hurricane Maria, the verdict is still out as to whether or not wiping out its debt obligations is a good idea. Will it encourage other disaster prone states to practice fiscal moral hazard in the hopes of a federal bailout? Or is it simply the humanitarian thing to do?

But one thing is certain: Puerto Rico got into its fiscal mess with European-level taxes, European-level spending, and the burden of vast and expensive government enterprises. No one can pin their fiscal problems on tax cuts.

Monday, September 18, 2017

The 1950’s Weren’t America’s Most Prosperous Decade: It’s Not Even Close

Click here to read the original Cautious Optimism Facebook post with comments

4 MIN READ - From the desk of the Cautious Optimism Correspondent for Economic Affairs and other Egghead stuff


In the recent crusade against “income inequality” it has become fashionable to cite the 1950’s as America’s greatest decade of economic growth—and then credit it almost exclusively to the period’s 91% top marginal income tax rate (the idea being that soaking the rich somehow promotes growth). 

In distant second place is crediting Dwight D Eisenhower’s push for the Interstate Highway System as a giant Keynesian government stimulus thus championing the virtues of large federal spending programs. 

In either case, the correlation of big-government interventions with an affluent decade is used to justify steeper taxes and higher government spending today with the promise of reliving the riches of the fifties.

But even though a multitude of deductions allowed nearly everyone to avoid paying the 91% rate, the larger fallacy in both arguments is that the 1950’s simply weren’t America’s greatest growth decade.

For one, the USA experienced two recessions during Happy Days (1953-54 and 1957-58) with two more bookending the decade (one bottoming in October 1949 with America just beginning a recovery in 1950, and another recession beginning in April 1960. Source: NBER). So the slightly longer 10-1/2 year period October 1949-April 1960 encompassed part or all of four recessions.

Second, based on real GDP growth the 1950’s decade barely ranks in America’s top five. Although no government figures exist before the 1930’s, academic estimates show without a doubt that America’s greatest decades of growth were during the post-Civil War era of the late 1800’s—when by the way there was no giant government spending program on interstate highways and federal peacetime spending was typically only 2-4% of GDP. 

And ironically by the income inequality crusader’s logic, the growth of the Gilded Age must have been fueled by the top marginal tax rate of zero since, with the brief exception of the Civil War, the federal income tax didn’t even exist until the passage of the 16th Amendment in 1913. So will the income inequality warriors now call for abolition of the income tax?

Statistics can be boring, but in this case a little slogging tells quite the compelling story. Using FRED/BEA figures for 1950-1960 and Johnston/Williamson numbers from usgovernmentspending.com for the 19th century we can compare the 1880’s, the decade when America emerged as the world’s largest economy, and the 1950’s real GDP and per-capita GDP growth rates:

Real GDP: 1950-1960. +42.3% ($2.184T to $3.108T, 2009 dollars)
Real GDP: 1880-1890. +66.7% ($207B to $345B, 2009 dollars)

Real per-capita GDP: 1950-1960. +20.1% ($14.4K to $17.3K, 2009 dollars)
Real per-capita GDP: 1880-1890. +32.6% ($4,123 to $5,467, 2009 dollars)

Real GDP sources: 
As you can see, it isn’t even close.

1850-1860 and 1870-1880 (even with the Depression of 1873) also outperform the golden 1950’s in both categories.

Real GDP gains for the Gilded Age decades were +65.5% and +70.8% respectively ($53.6B to $88.7B and $121.3B to $207.2B, 2009 dollars).

And real per-capita GDP gains were +22.2% and +35.7% respectively ($2,303 to $2,815 and $3,039 to $4,123, 2009 dollars).

Even the destitute 1980’s—when we’re told the great riches of the postwar era were squashed under heartless Ronald Reagan’s iron boot when he cut the top marginal rate from 70% to 28%—outperforms the 1950’s on a per-capita basis. 

Although real GDP grew by a slightly lower 38.9% ($6.45T to $8.96T, 2009 dollars), slower population growth translates to a superior real per-capita increase of 26.3% ($28.5K to $36.0K, 2009 dollars).

Third and finally, what growth came out of the 1950’s isn’t explained by 91% high tax rates, wealth redistribution or the Interstate Highway System at all, but rather by the very unsexy, boring, and little-understood international monetary arrangement of the time. 

Under the postwar Bretton-Woods agreement the US dollar served as the world’s anchor-reserve currency due to its peg to America’s vast gold reserves, and other member nations’ currencies were convertible to US dollars at fixed exchange rates. However, America’s low money stock-to gold reserves ratio in the first 15-20 years of Bretton Woods undervalued the dollar via its trading partners’ currencies—the exact opposite phenomenon of the overvalued British pound during the interwar gold-exchange standard. 

Unlike Britain, which during the 1920’s suffered from chronic trade deficits and gold outflows due to its overvalued currency, the US experienced an export boom during the 1950’s and most of the 1960’s due to the undervalued dollar.

With the exception of the US having already been a developed economy during the 1950’s, strong American exports were driven much the same way China’s deliberately undervalued yuan—pegged at fixed exchange rates to the US dollar by the People’s Bank of China—has stimulated its current export boom. 

But the party came to an end in the late 1960’s when aggressive money creation by the Federal Reserve to finance deficits for Lyndon Johnson’s Great Society and the Vietnam War reversed the dollar’s undervalued status to overvalued. America’s trade surpluses turned to chronic trade deficits and the late 1960’s Fed-induced stock market bubble popped, leading America into the stagflation era of the 1970’s.

Sometimes sound answers to economic questions can be a little bit complicated, but Bretton-Woods and an undervalued dollar aren’t quite the progressive soundbite the “91% tax rates made us wealthy” forces are looking for. And certainly neither is “zero tax rates drove America’s truly most prosperous decades.”

Friday, September 8, 2017

The End of Canada's Zero Interest Rate Policy


2 MIN READ - The Cautious Optimism Correspondent for Economic Affairs and other Egghead Stuff reflects on Fed/Central bank policy/effectiveness across the US and The Great White North.

The Bank of Canada building has added floors since 1935
On Wednesday the Bank of Canada raised its overnight lending rate for the second time in two months to 1%--meaning its next rate hike will end over eight years of 1% or lower interest rate policy and signal the end of an unprecedented era of cheap money that many believe has fueled real estate bubbles in key Canadian metro areas.

By contrast, Canada's banking system going back to the late 18th century had been largely free of government control and nearly totally unregulated, functioning without a central bank all the way until 1935—well after the Great Depression had already bottomed out.

Lacking restrictions on branch banking that had plagued American unit banks for over a century, and free from distorting controls imposed on US banks by the National Bank Acts (1862-1913) and the First and Second Banks of the United States (1791-1811, 1816-1836), Canada never suffered a systemic banking crisis in its entire history versus the roughly fifteen that the United States has endured reaching back to 1797.

Under its freer and less regulated system, Canada also did not experience a single bank failure during the Great Depression compared to the nearly 10,000 failures the United States suffered from 1929 to 1933 under the watchful eye of the Federal Reserve.

(click here to read FEE.org's report on the historical contrast between the Canadian and American systems https://fee.org/articles/banking-before-the-federal-reserve-the-us-and-canada-compared/)

However, in the decades since the Bank of Canada opened its doors in 1935, Canada's banking system has increasingly mirrored its southern neighbor's with a powerful central bank issuing monopoly fiat money and centrally planning interest rates and monetary policy.

And while Canada has benefited from its citizens' traditionally conservative household finances and absence of the affordable housing crusades that flowed from Washington, DC during the 2000's, the Bank of Canada's ultra-easy money policy of the last eight years and the real estate bubbles it has blown in major metro areas raises doubts as to whether Canada can avoid its first full-fledged financial crisis.

Even if it survives this tightening cycle, is an end to Canada's remarkable lifetime streak of zero bank crises coming in our lifetimes given its abandonment of free banking policies for central planning in money?

Tuesday, August 15, 2017

Solar and Wind Energy Subsidies vs Oil and Natural Gas

Click here to read the original Cautious Optimism Facebook post with comments

3 MIN READ - Fresh dispatch from the Cautious Optimism Correspondent for Economic Affairs and other Egghead Stuff. Here he drills into some Energy issues.


As CO has recently reported on solar energy’s cost inefficiencies against traditional natural gas or even coal, it’s helpful to take a closer look at the ugly subsidies side of the equation. How much government assistance does solar (and its little brother wind) receive to still remain uncompetitive?

It turns out according to the U.S. government’s own EIA report, solar receives over 1,600 times more subsidy dollars per KWh generated than traditional coal and petroleum (96.8 cents per KWh vs 6/100ths of a cent).

For the NCPA story which links to the U.S. Energy Information Administration's study go to...

http://environmentblog.ncpathinktank.org/which-energy-source-receives-the-largest-subsidy/


The EIA study was conducted during FY10 at the height of the failed Obama green energy spending spree, but even today solar and wind still massively outcollect government money via their fossil fuel competitors per KWh generated.

And while solar and wind get direct government payments, fossil fuel “subsidies” are mostly writedowns on equipment depreciation—a form of “subsidy” that all companies take. Furthermore, these metrics exclude “reverse subsidies” (i.e. taxes paid).

For example, in the decade FY2005-FY2014 one petroleum company alone, ExxonMobil, paid over $250 billion in corporate income taxes, or over a quarter trillion (yes, trillion with a “T”, see links below to SEC filings) dollars. 

This also excludes the additional retail energy taxes collected on the energy the company sells, and ExxonMobil is just one payer alongside other giant energy companies like ChevronTexaco, BP, Total, ConocoPhillips, Schlumberger, Transocean, Baker Hughes, and literally hundreds of others.

Some critics argue that wind and solar costs are all up front—in the production and installation of the panels and windmills—and that the energy flows at much lower cost. But it's worth reminding such critics that traditional petroleum's costs too are very front-heavy with major capital expenditures in exploration, drilling, and infrastructure.

For example, contracting an offshore drilling rig that can cost half-a-million to nearly a million dollars per day to operate (during periods of high demand), petroleum companies can pay over $100 million for a single offshore drilling project and in most cases find nothing.

Once all the costly failures are logged and a rig finally hits an oil and gas field, production rigs move in and energy is extracted at much lower cost. But petroleum companies make enormous upfront capital investments just like renewables, usually to fail.

The same is true with the expansion of refineries or construction of pipelines with large upfront costs and much lower operating costs once they are built. Or as mentioned in one of CO’s previous articles, there are also upfront costs associated with building natural gas electric power stations.

Factoring in all the financials—direct federal subsidies to wind and solar and enormous taxes paid by traditional fossil fuels companies, green energy should easily have the upper hand. Government props it up heavily while simultaneously hobbling and handicapping its competition.

Yet even with all its state-support, the propaganda claims of “competitiveness” still fall flat. When government help is removed from the calculus, the claims appear downright absurd.

One of the common refrains from those advocating “green” energy is that we need to stop subsidizing coal, oil and natural gas. And while they admit, even advocate for, the existence of subsidies for wind, solar and the like, they imply that if only we got rid of subsidies for oil, those other forms of energy would lose their competitive advantage and the world would automatically move to green sources.

They're at best only 1/1600th correct.

To verify ExxonMobil's corporate taxes paid for the 2005-2014 period, check the company's SEC filings (pages 41, 56, 53, and 53 respectively) at...


https://www.sec.gov/Archives/edgar/data/34088/000119312508041781/d10k.htm
https://www.sec.gov/Archives/edgar/data/34088/000119312511047394/d10k.htm
https://www.sec.gov/Archives/edgar/data/34088/000003408814000012/xom10k2013.htm
https://www.sec.gov/Archives/edgar/data/34088/000003408815000013/xom10k2014.htm